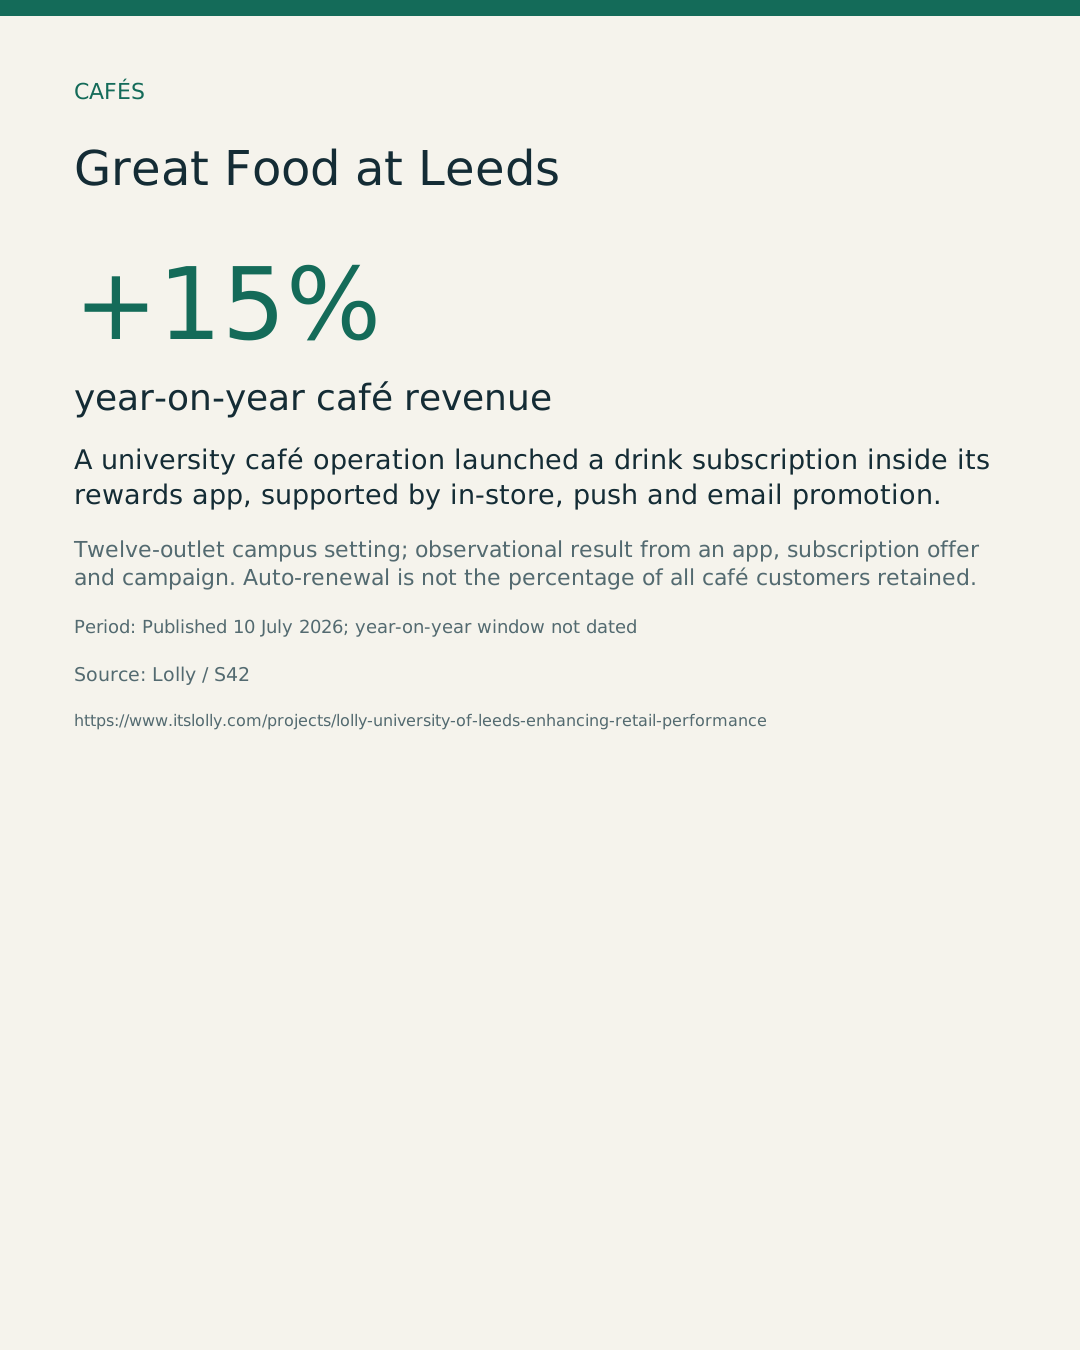
Great Food at Leeds
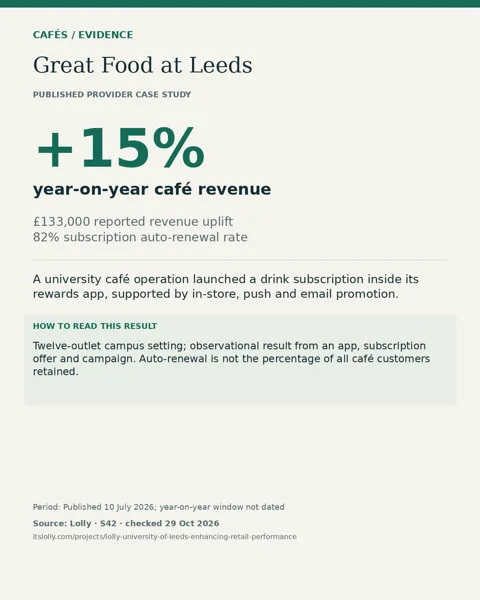
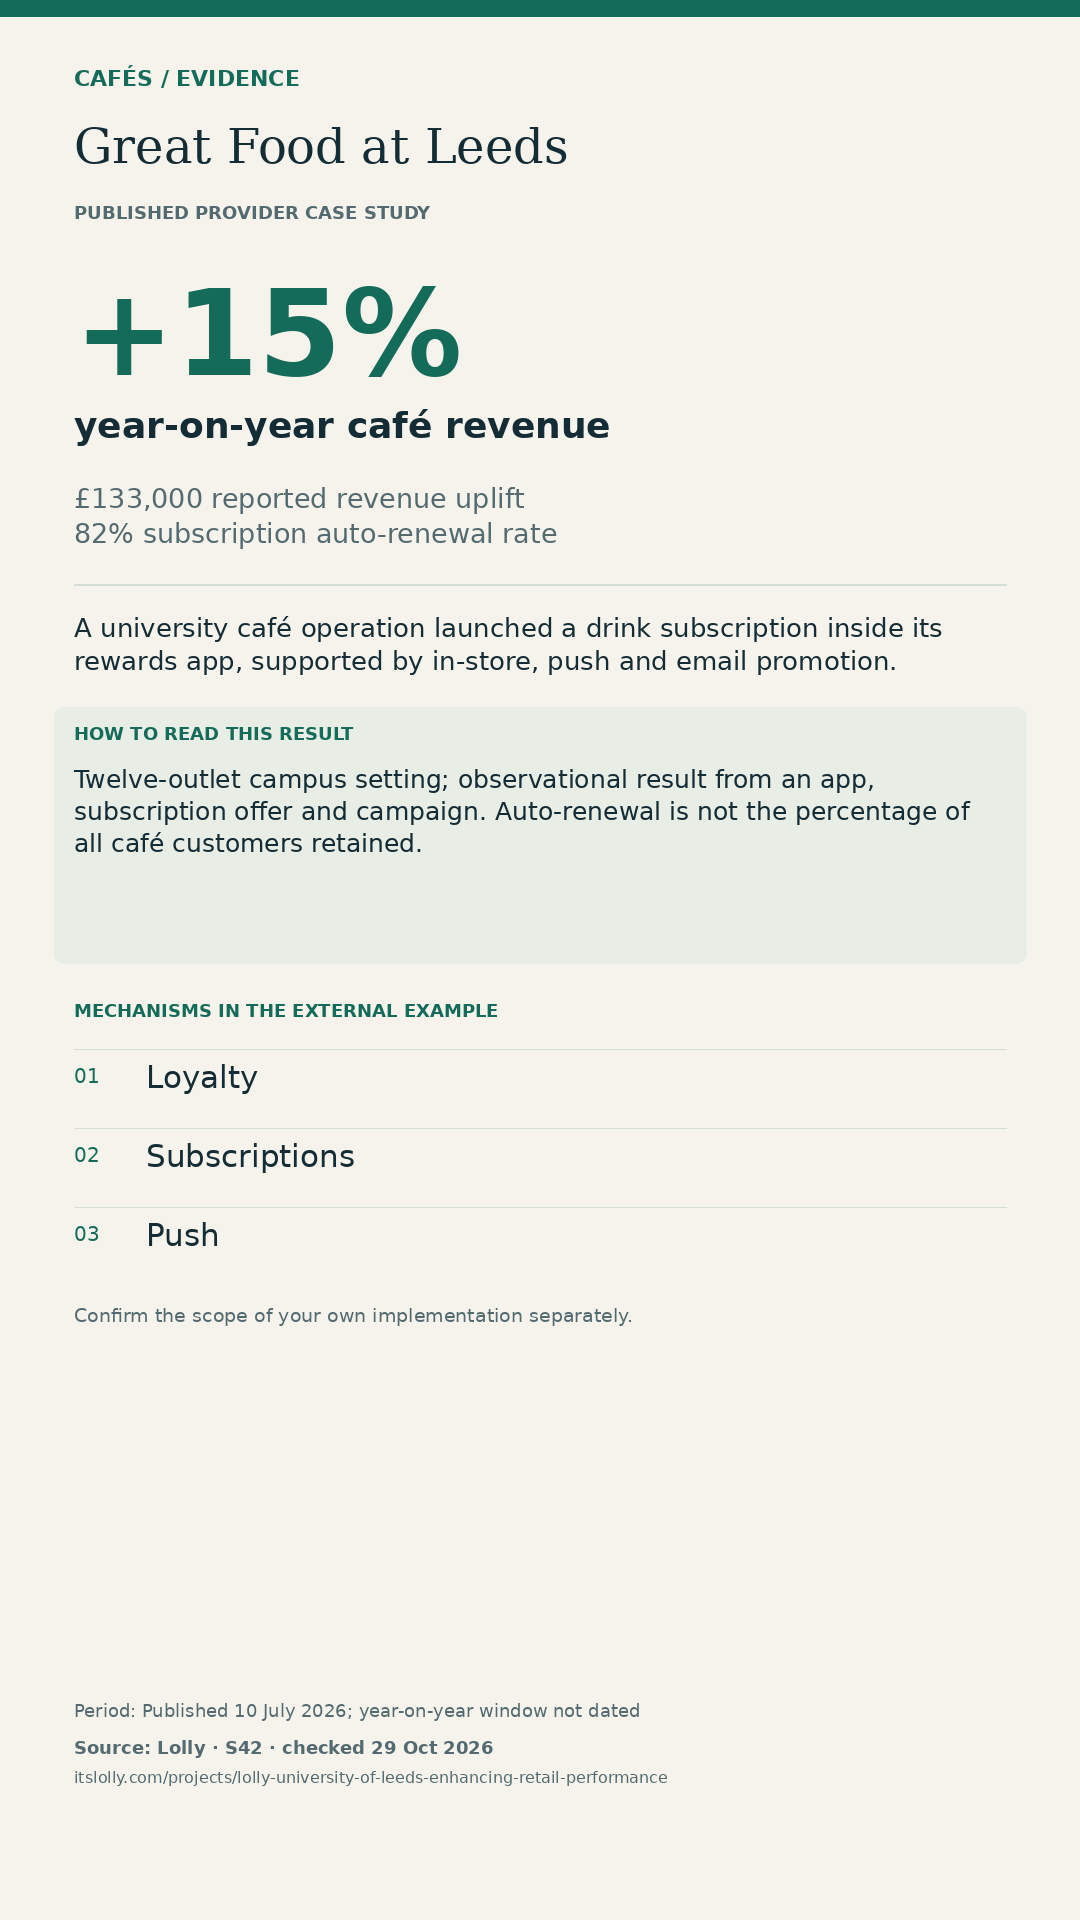
+15% year-on-year café revenue
Source: Lolly. Twelve-outlet campus setting; observational result from an app, subscription offer and campaign. Auto-renewal is not the percentage of all café customers retained.
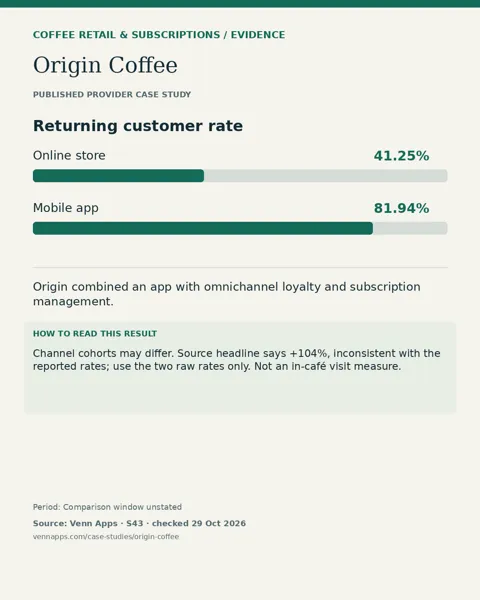
Use these graphics in presentations, proposals or social posts. Keep the source and context intact. The businesses shown are external examples, and their results are not guaranteed.
38 designs
+15% year-on-year café revenue
Source: Lolly. Twelve-outlet campus setting; observational result from an app, subscription offer and campaign. Auto-renewal is not the percentage of all café customers retained.
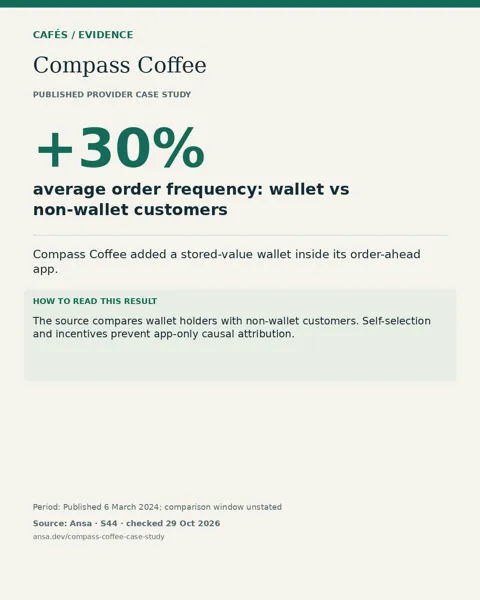
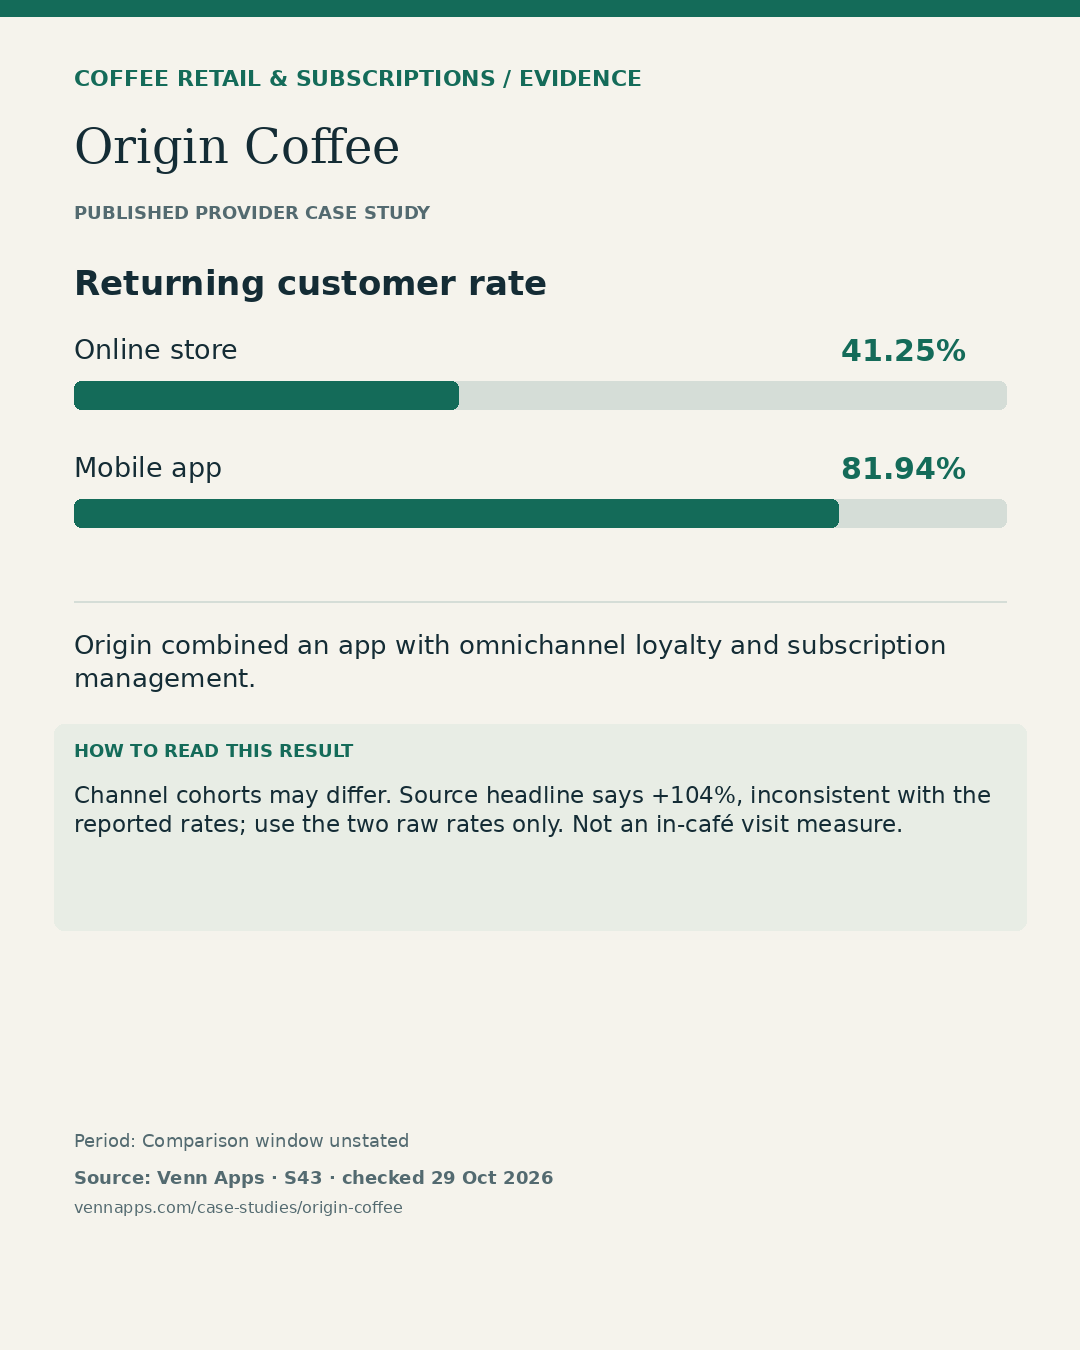
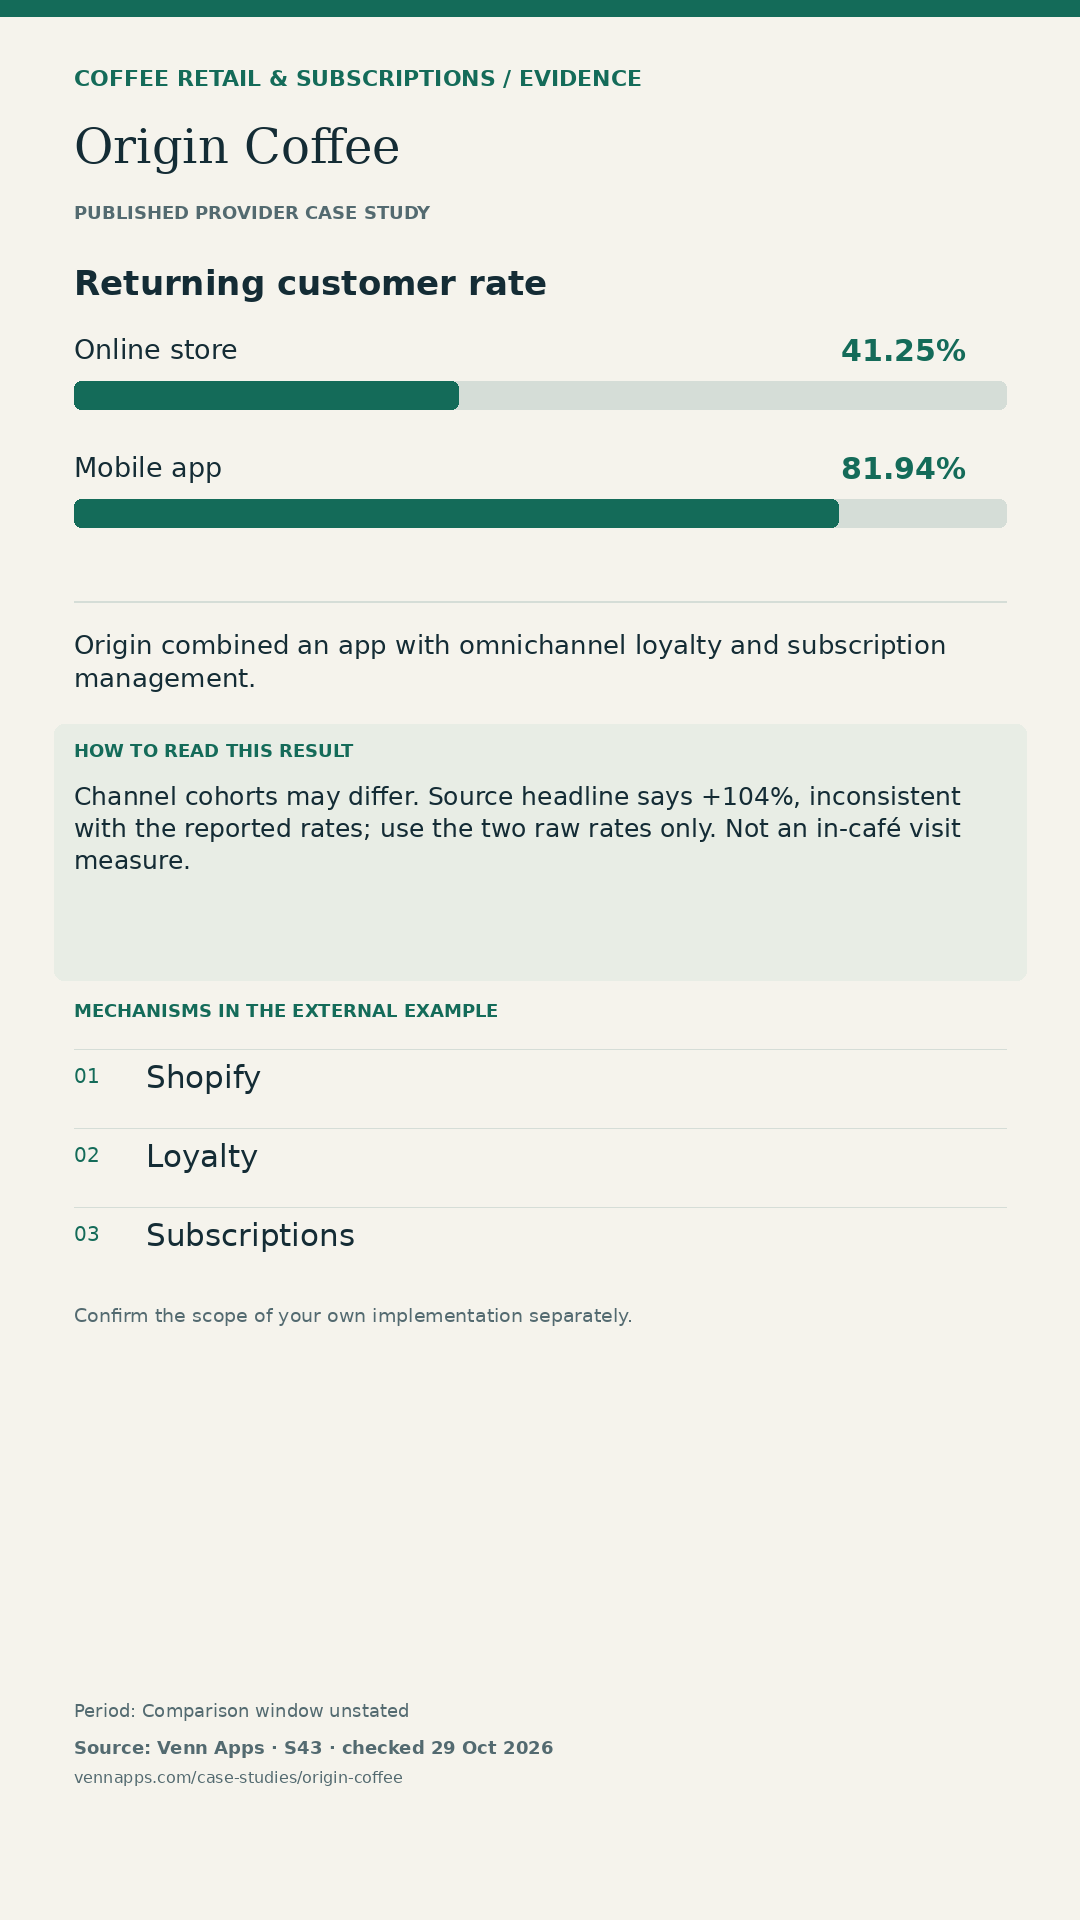
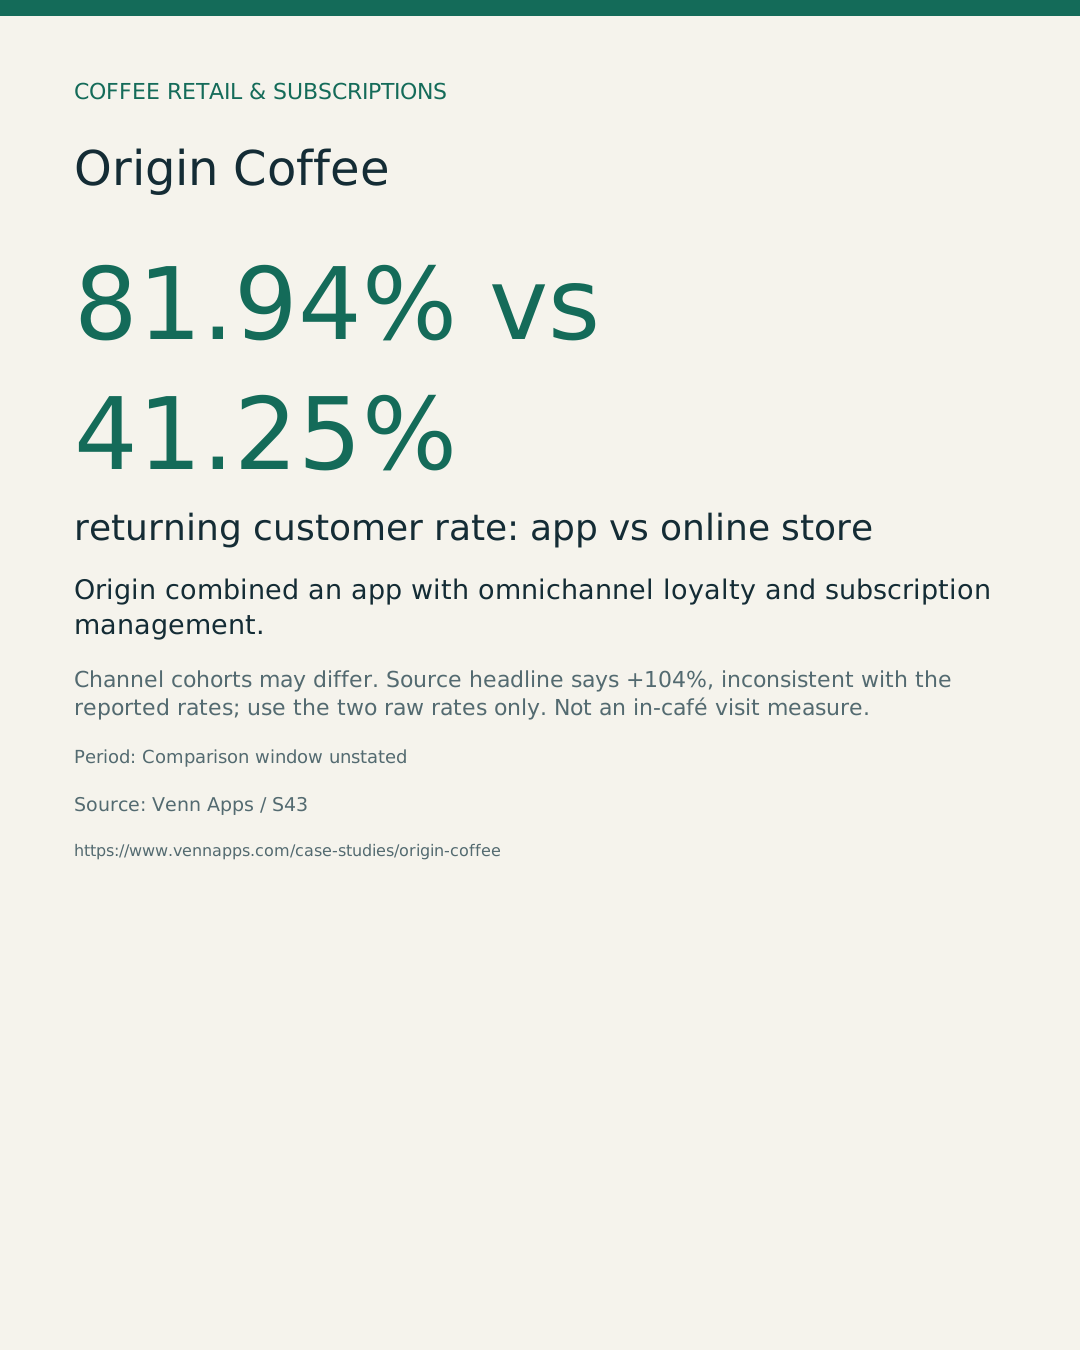
81.94% vs 41.25% returning customer rate: app vs online store
Source: Venn Apps. Channel cohorts may differ. Source headline says +104%, inconsistent with the reported rates; use the two raw rates only. Not an in-café visit measure.
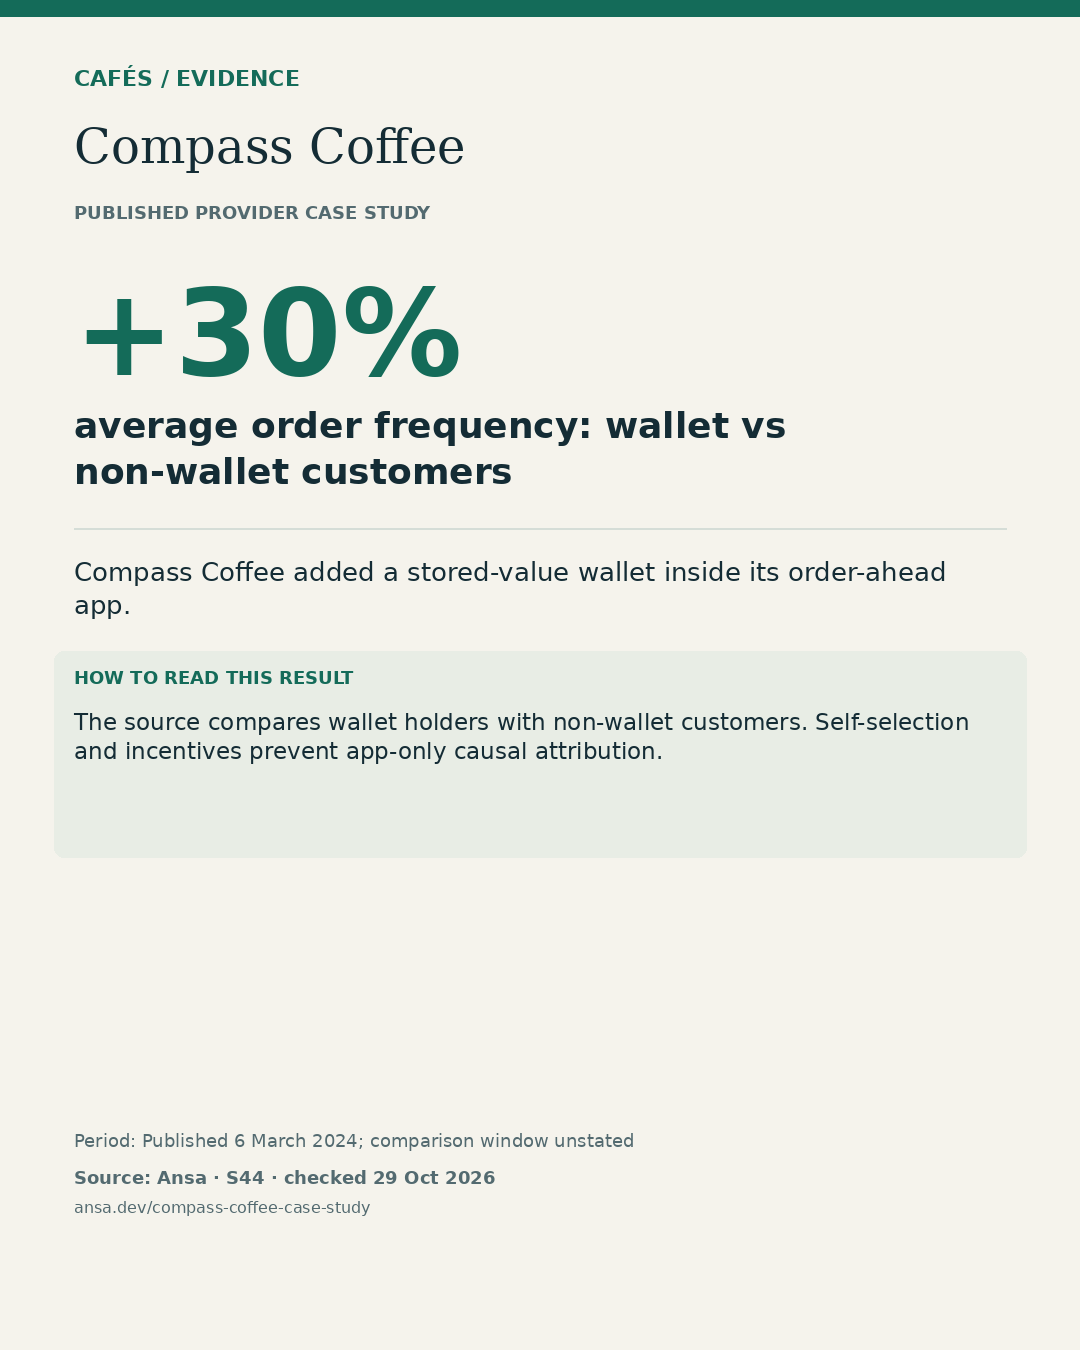
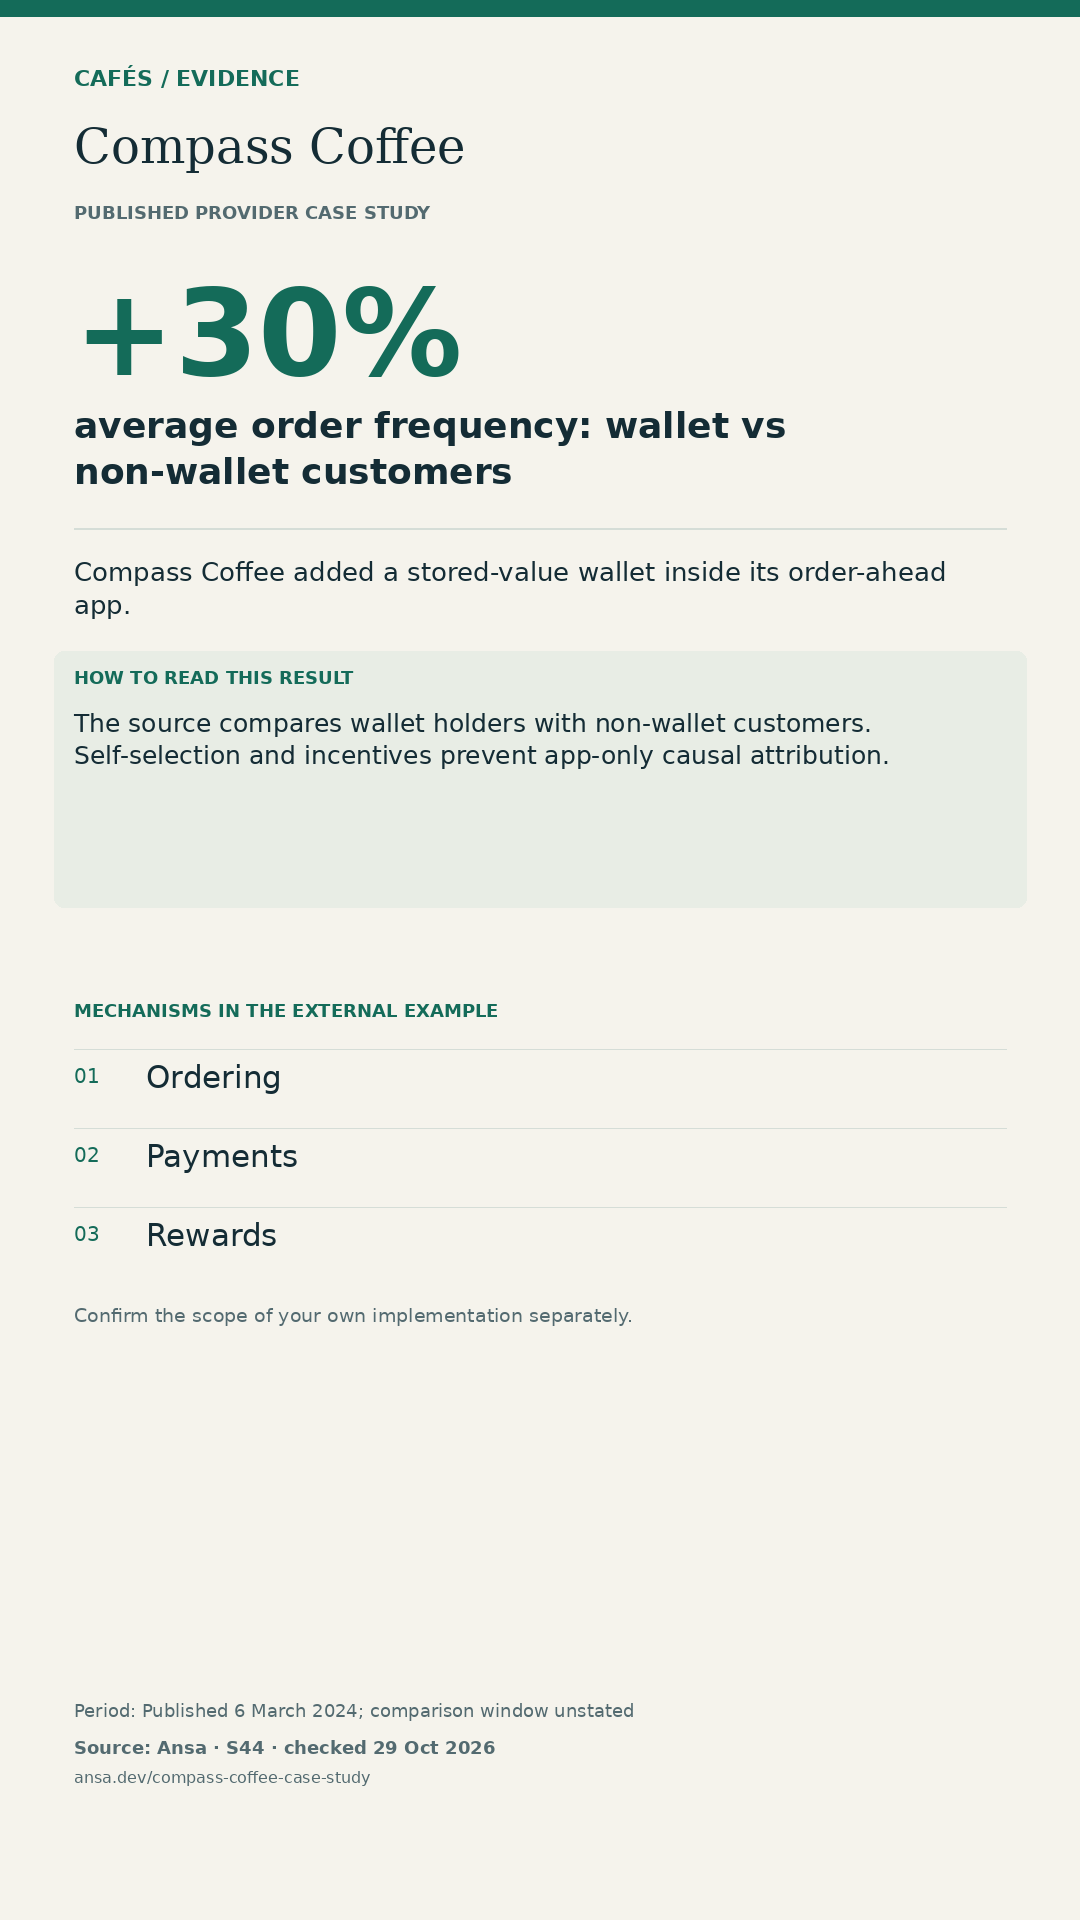
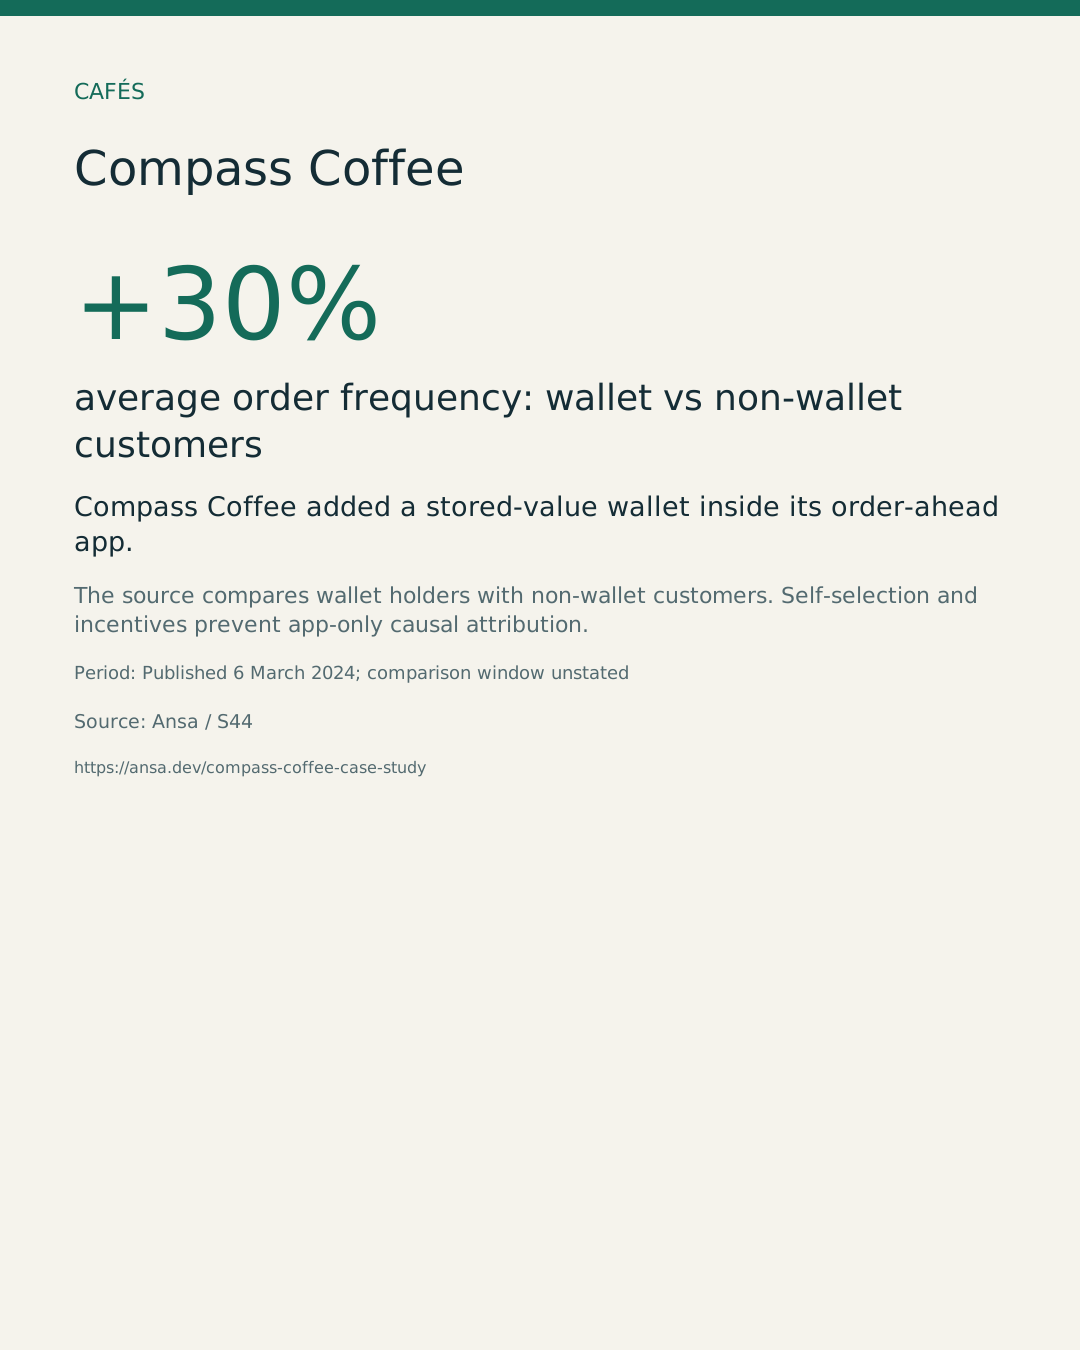
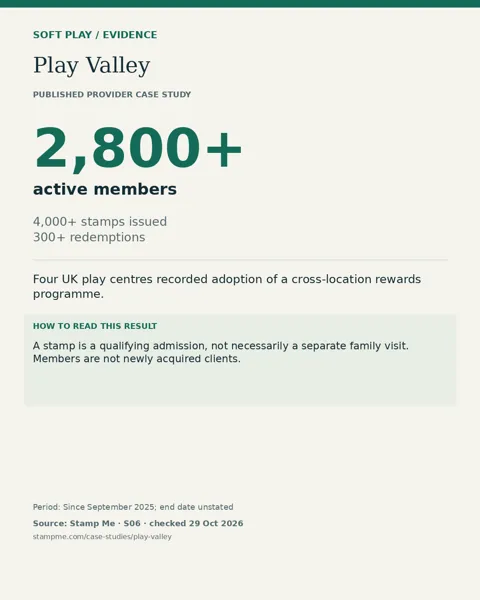
+30% average order frequency: wallet vs non-wallet customers
Source: Ansa. The source compares wallet holders with non-wallet customers. Self-selection and incentives prevent app-only causal attribution.
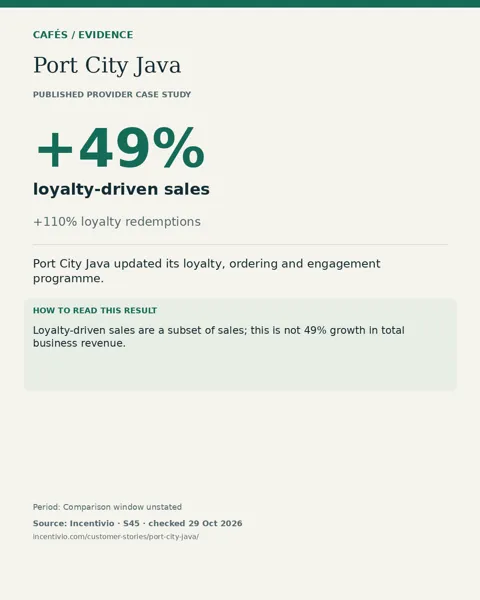
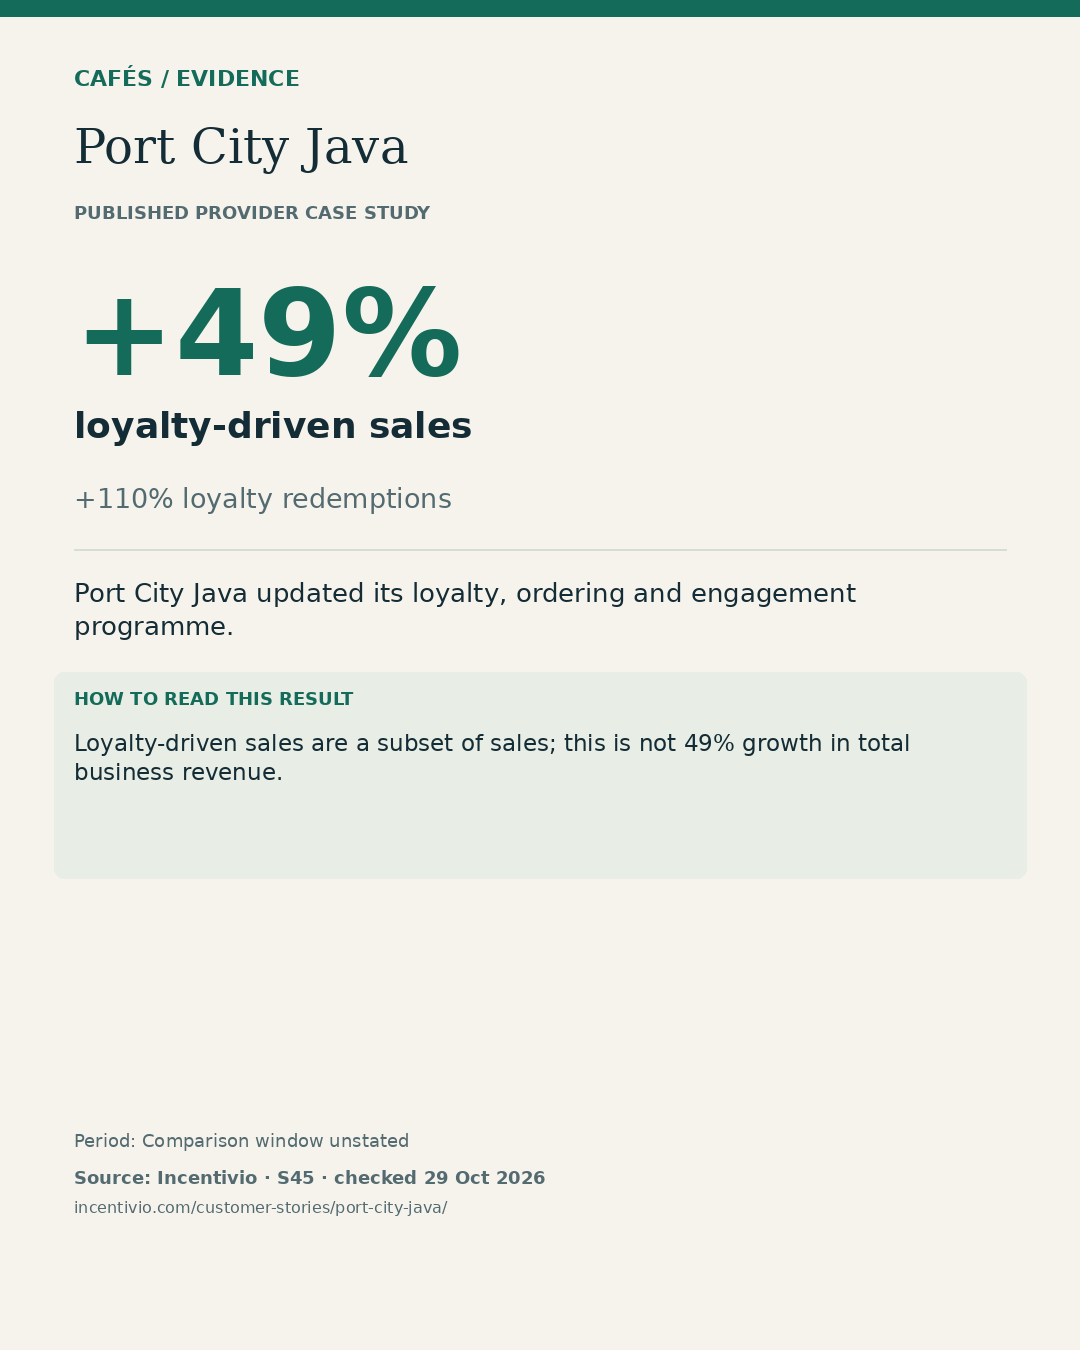
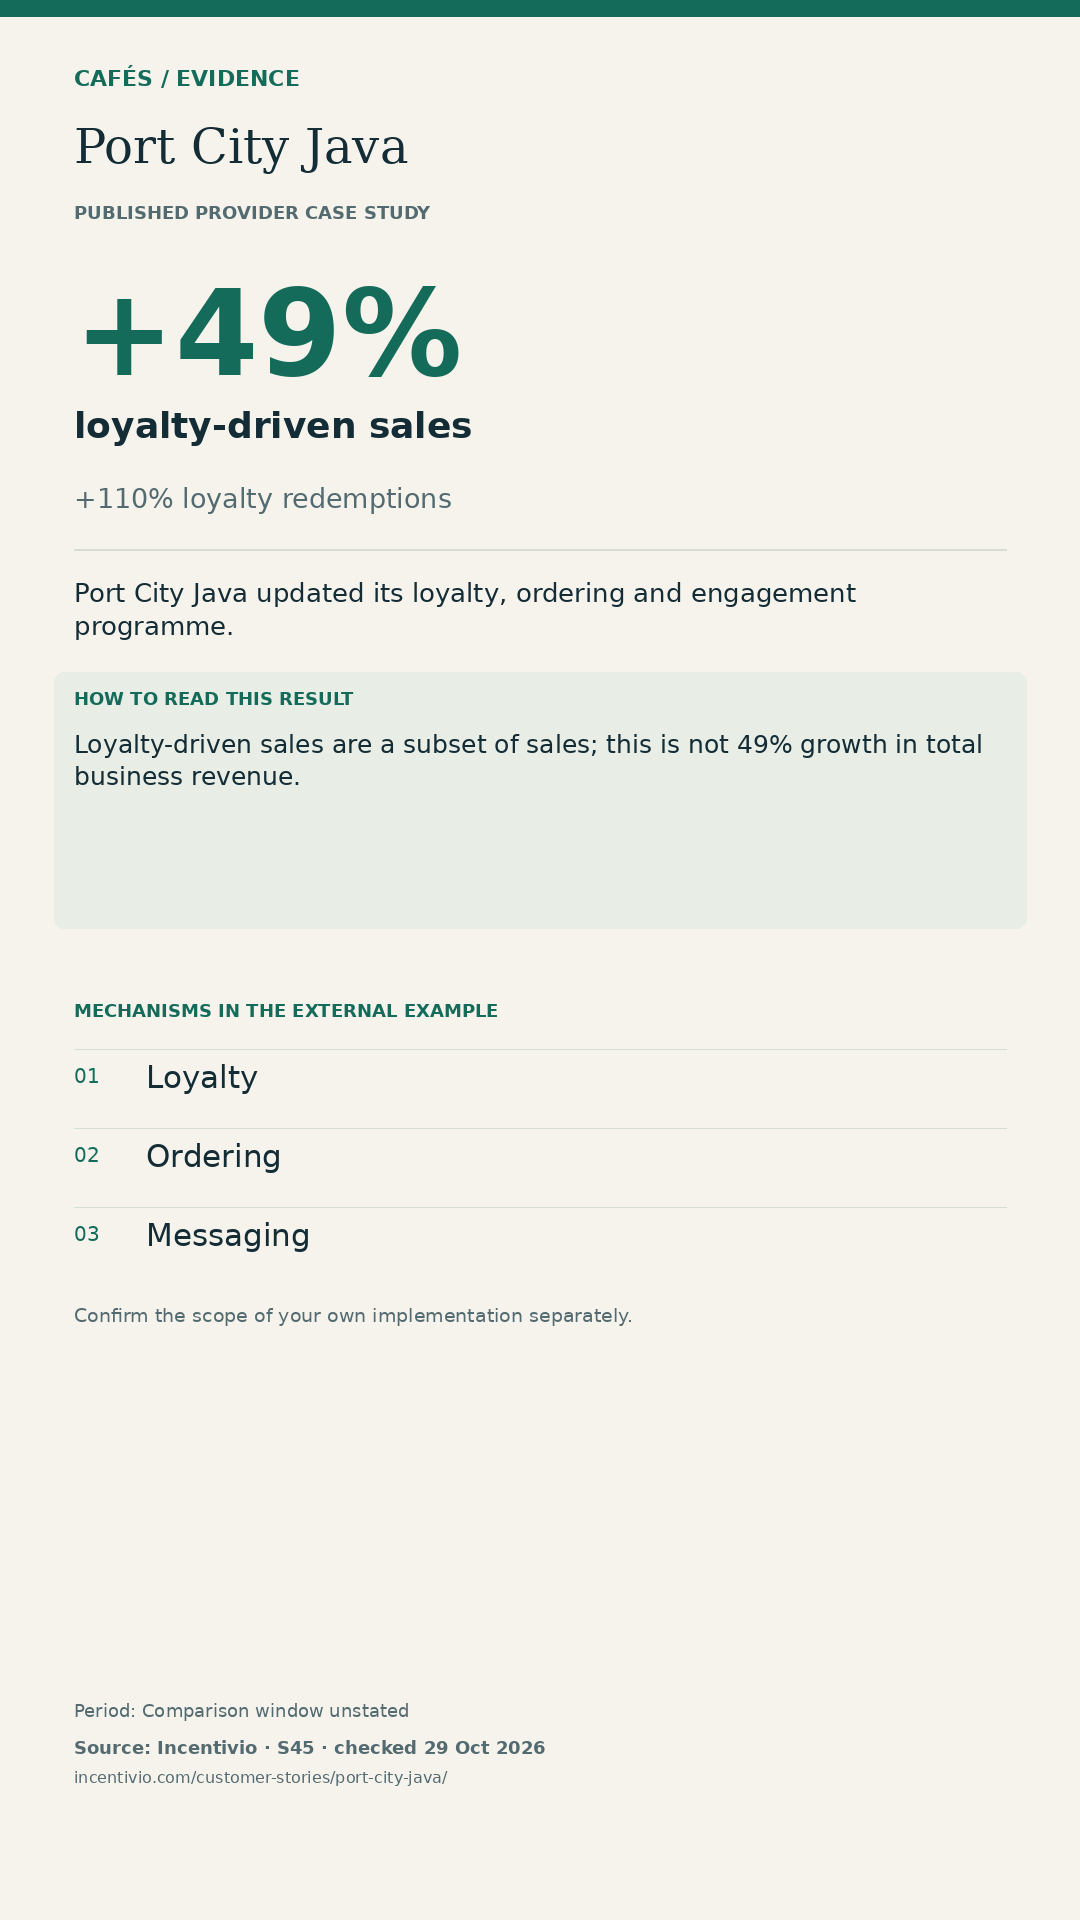
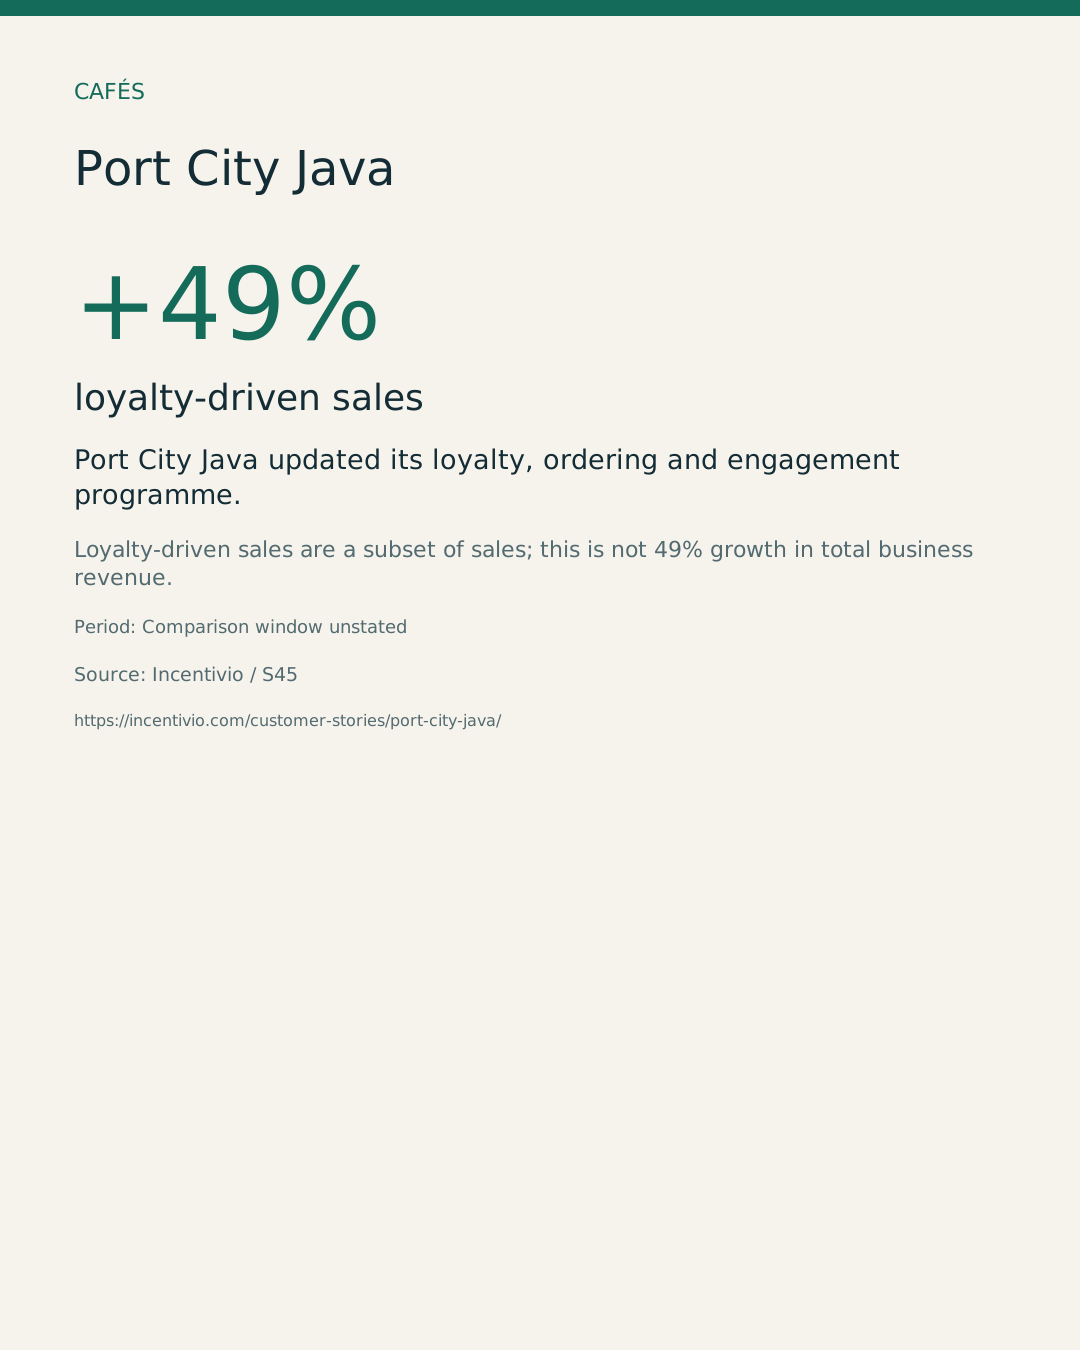
+49% loyalty-driven sales
Source: Incentivio. Loyalty-driven sales are a subset of sales; this is not 49% growth in total business revenue.
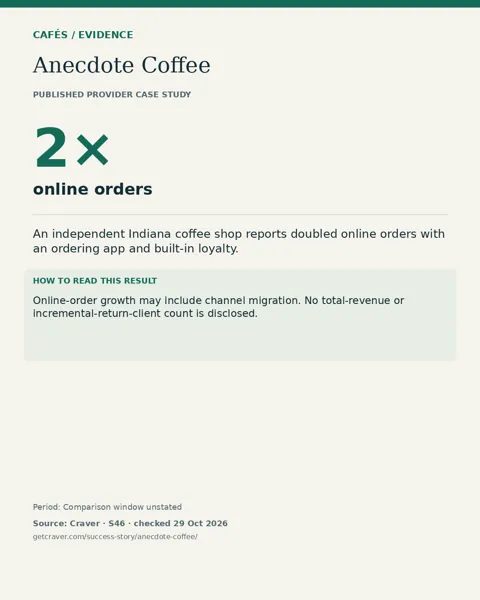
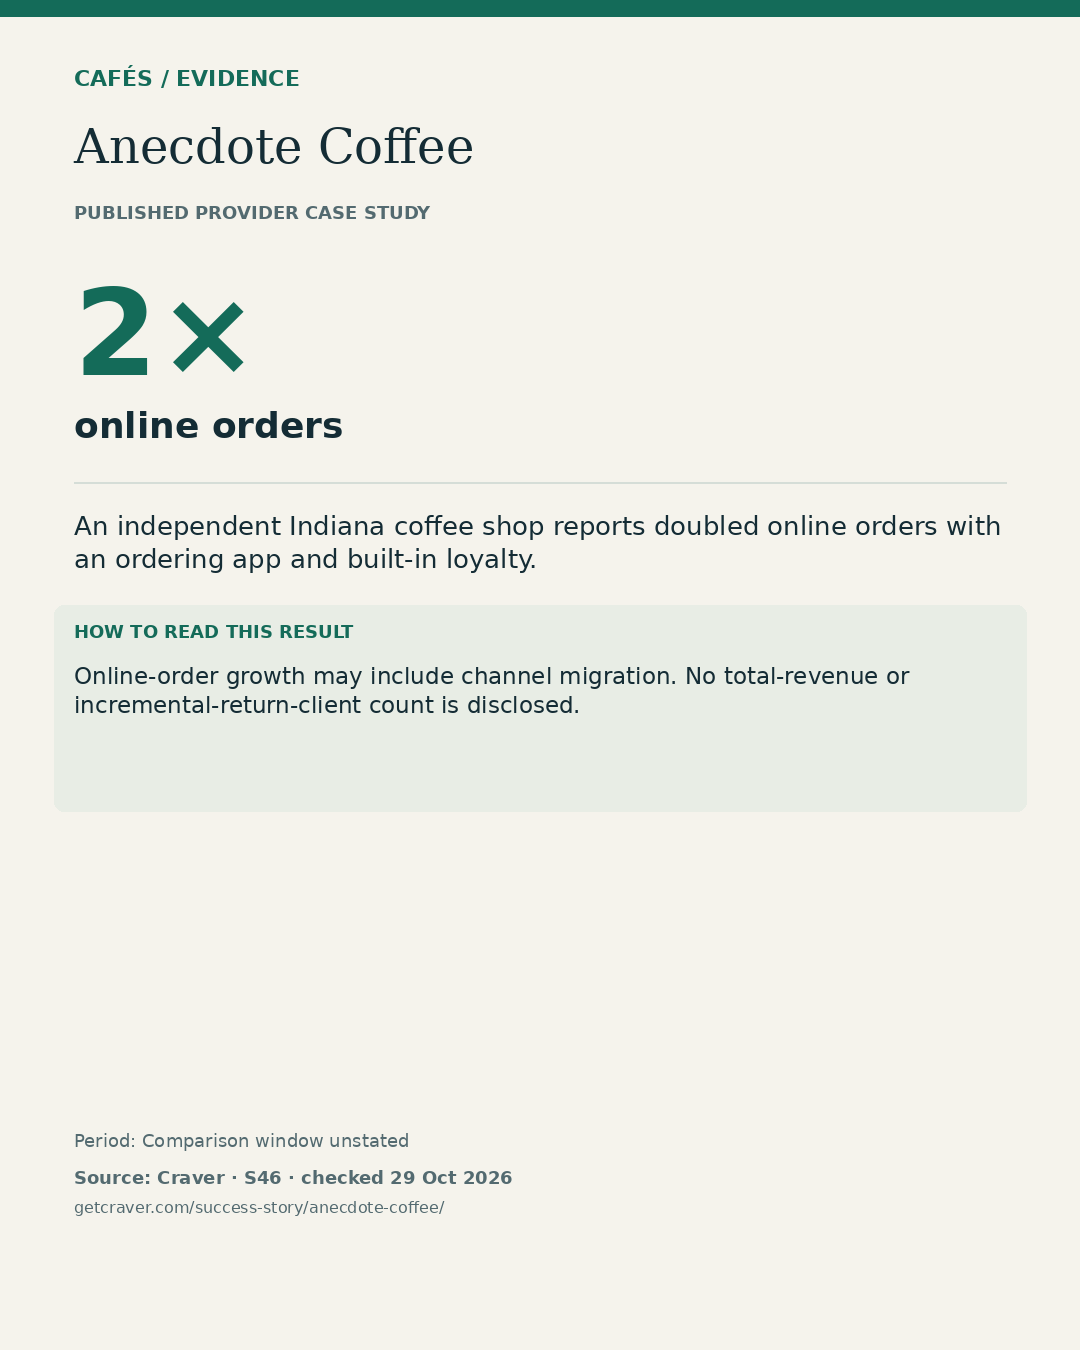
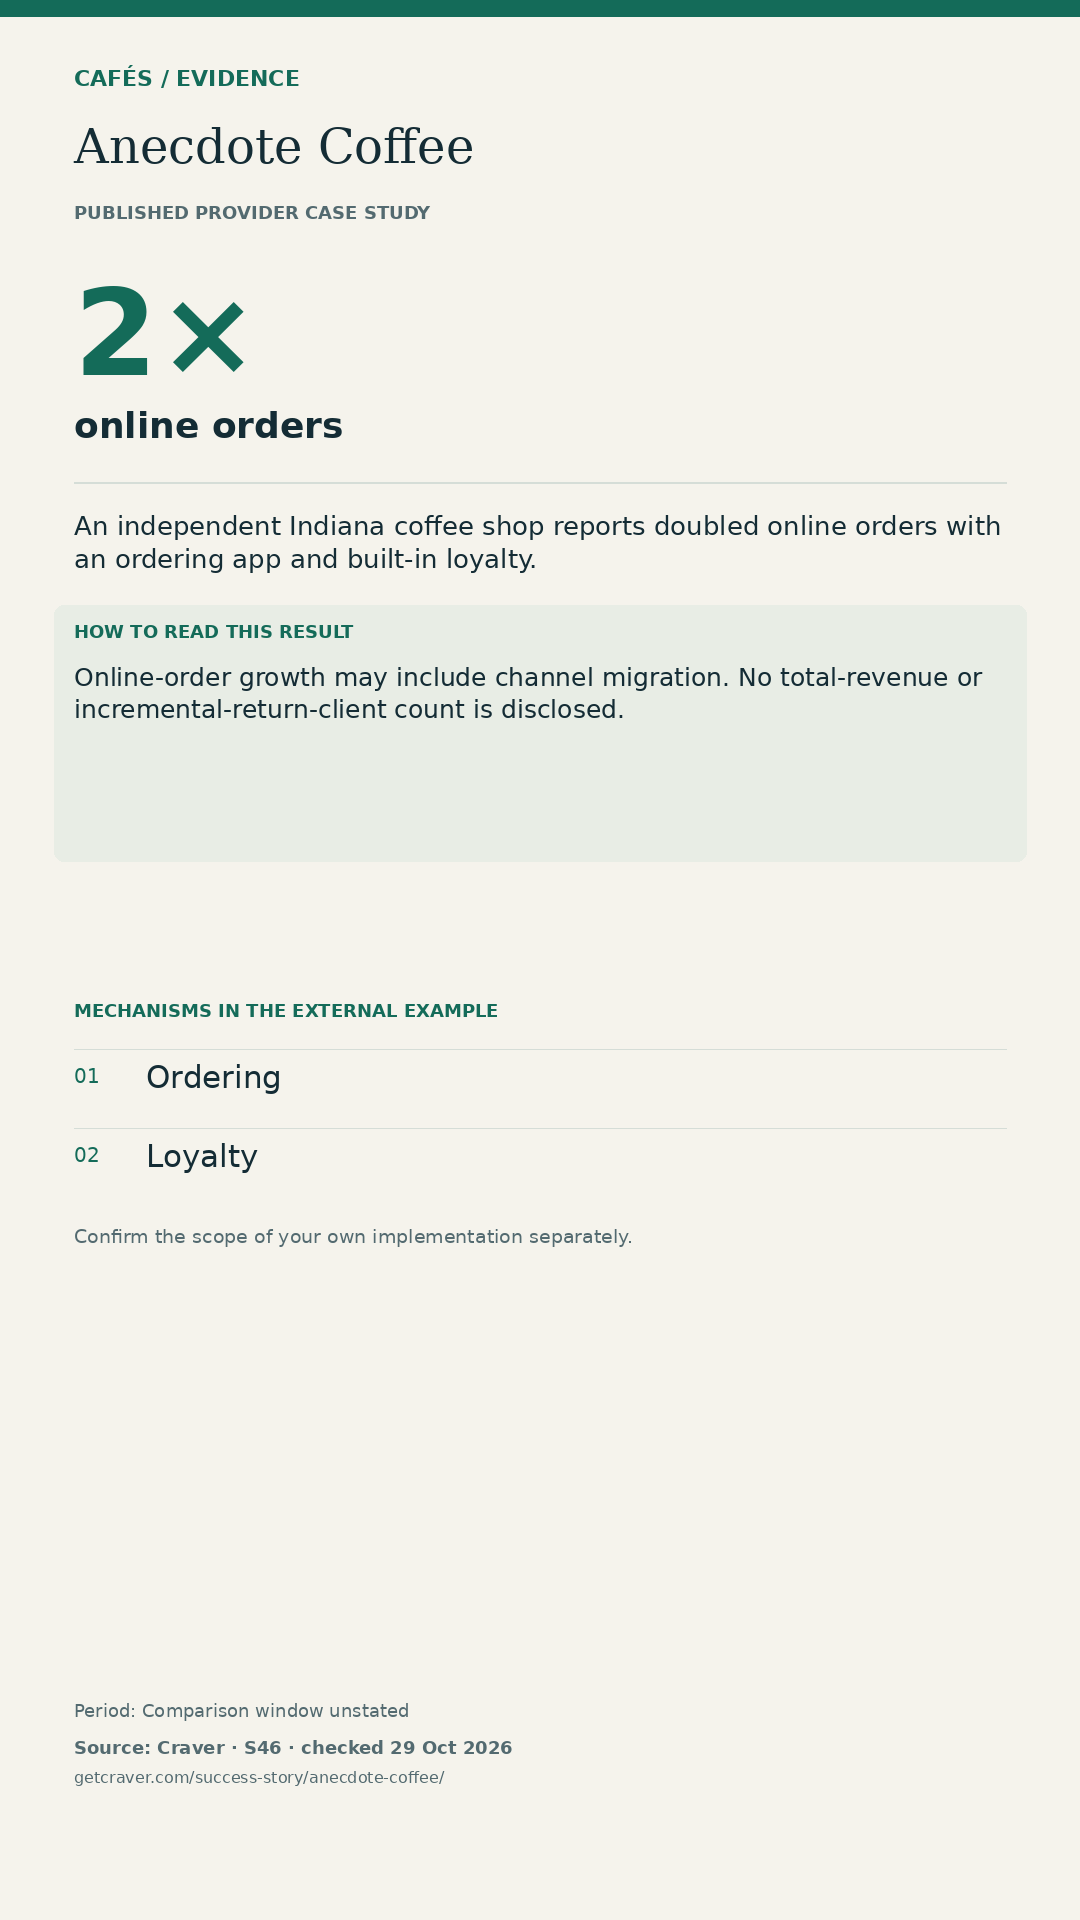
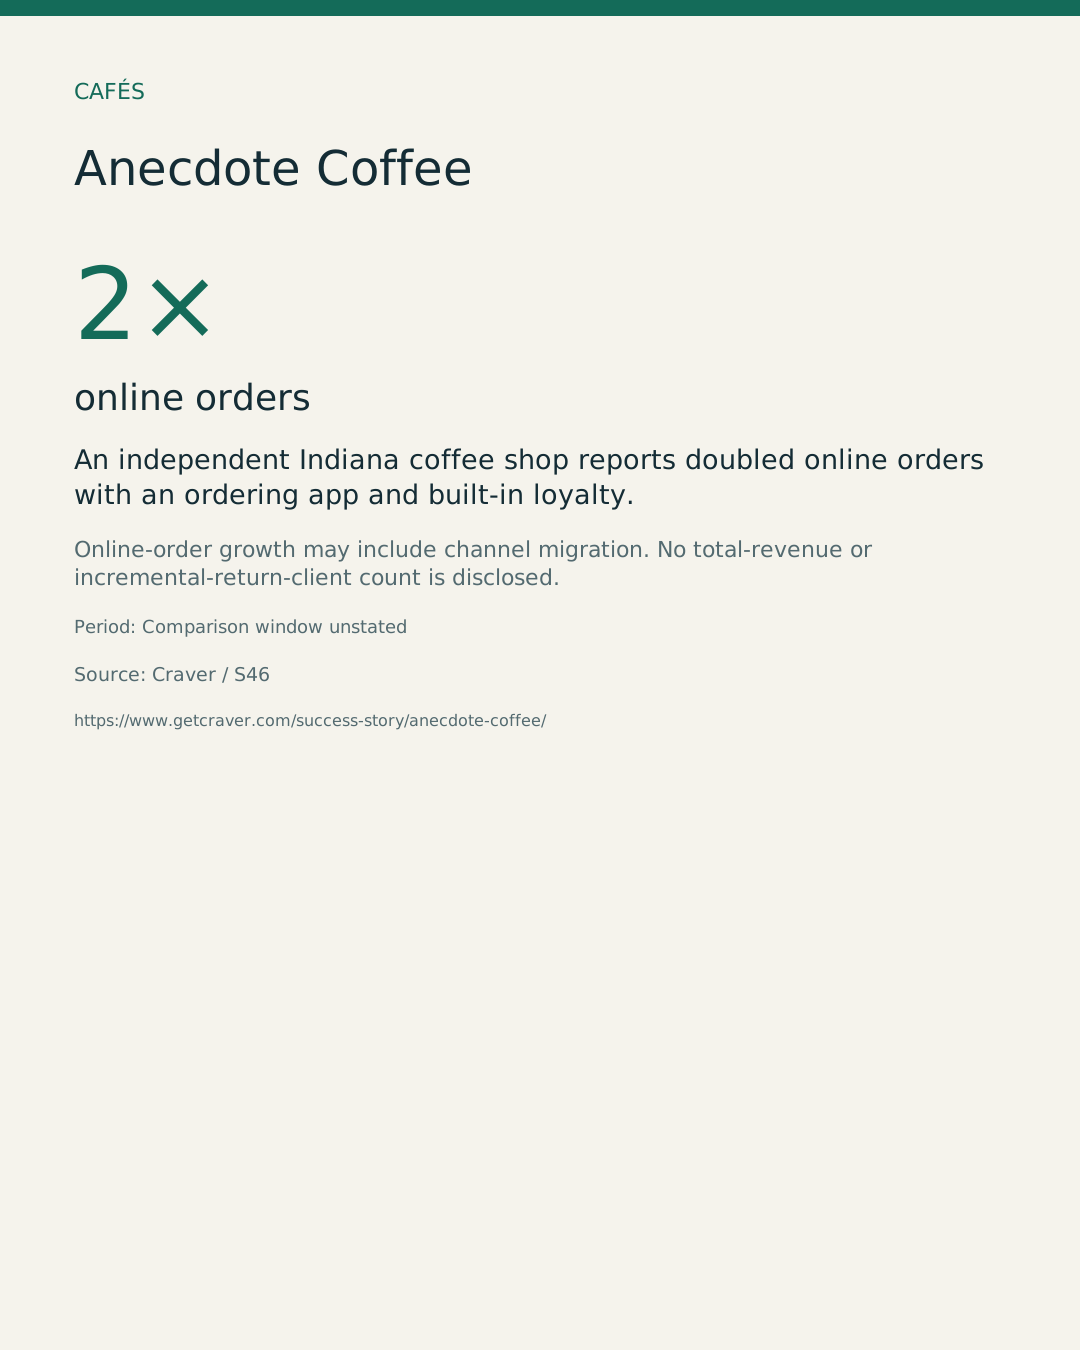
2× online orders
Source: Craver. Online-order growth may include channel migration. No total-revenue or incremental-return-client count is disclosed.
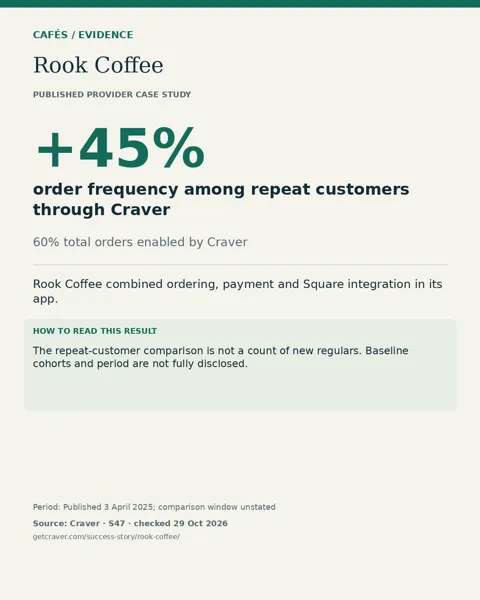
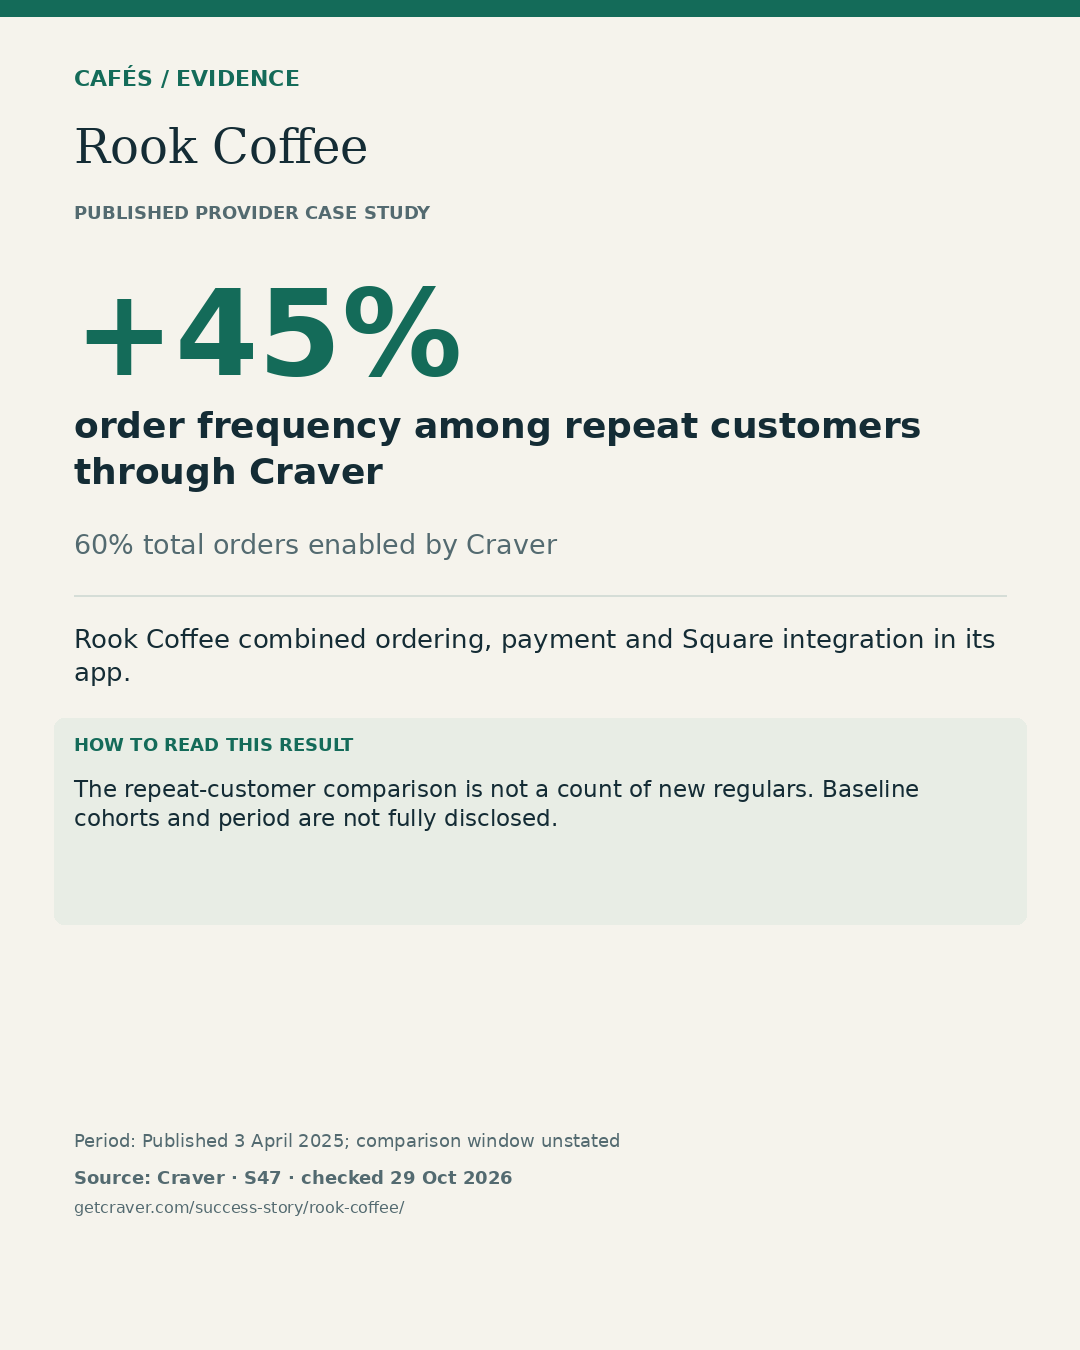
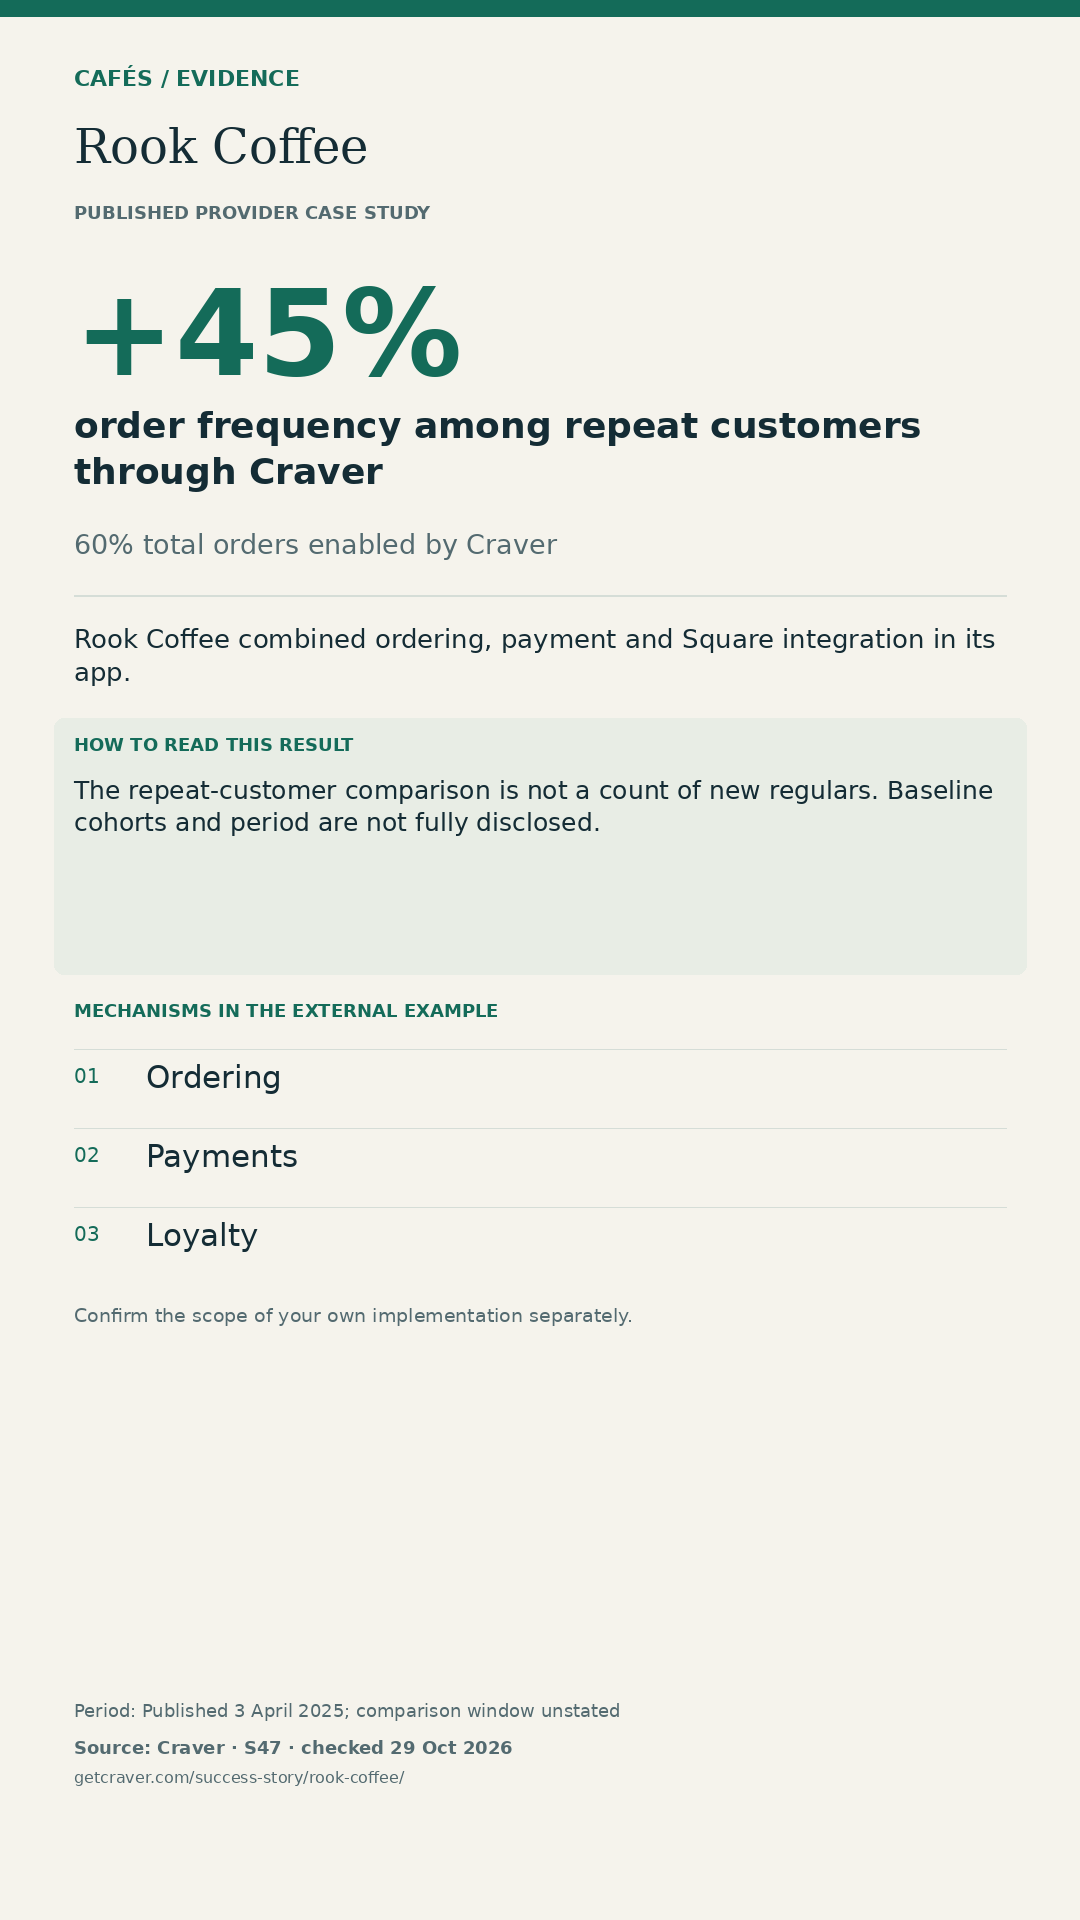
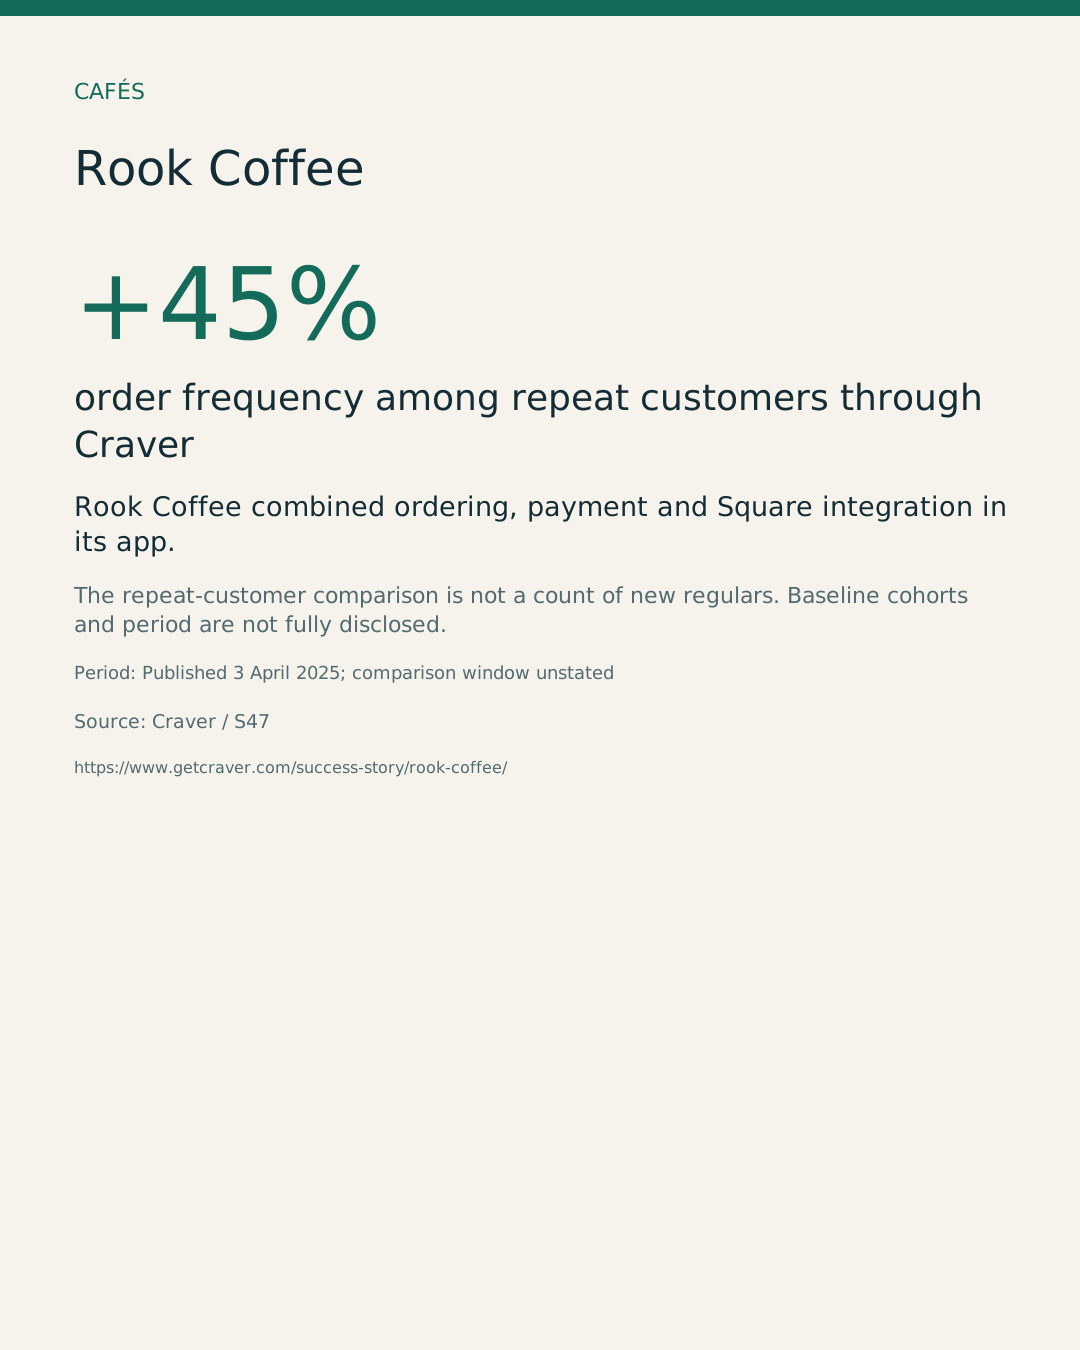
+45% order frequency among repeat customers through Craver
Source: Craver. The repeat-customer comparison is not a count of new regulars. Baseline cohorts and period are not fully disclosed.
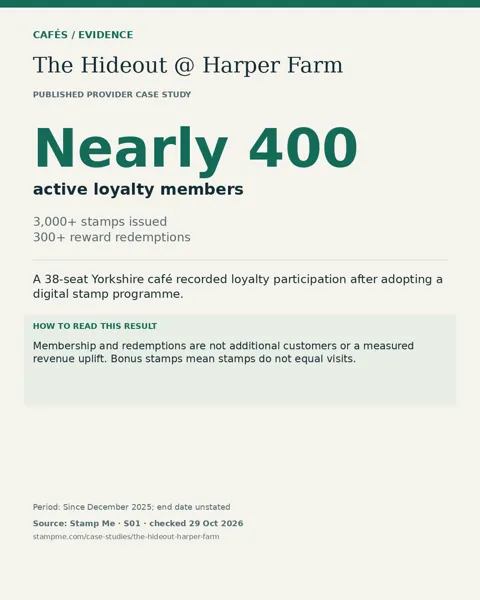
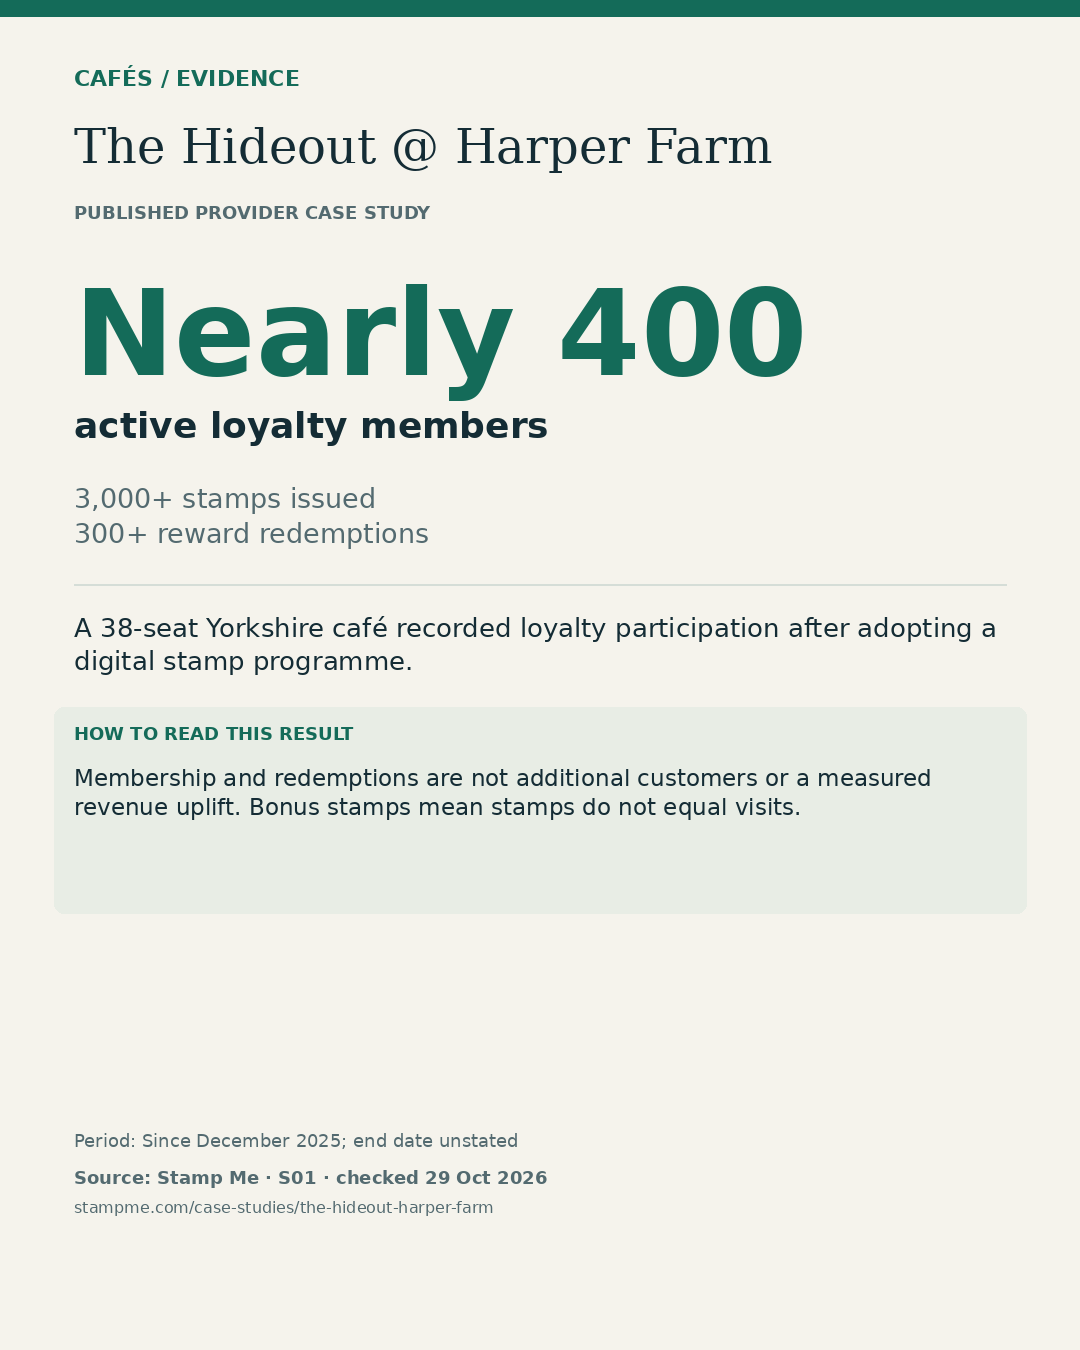
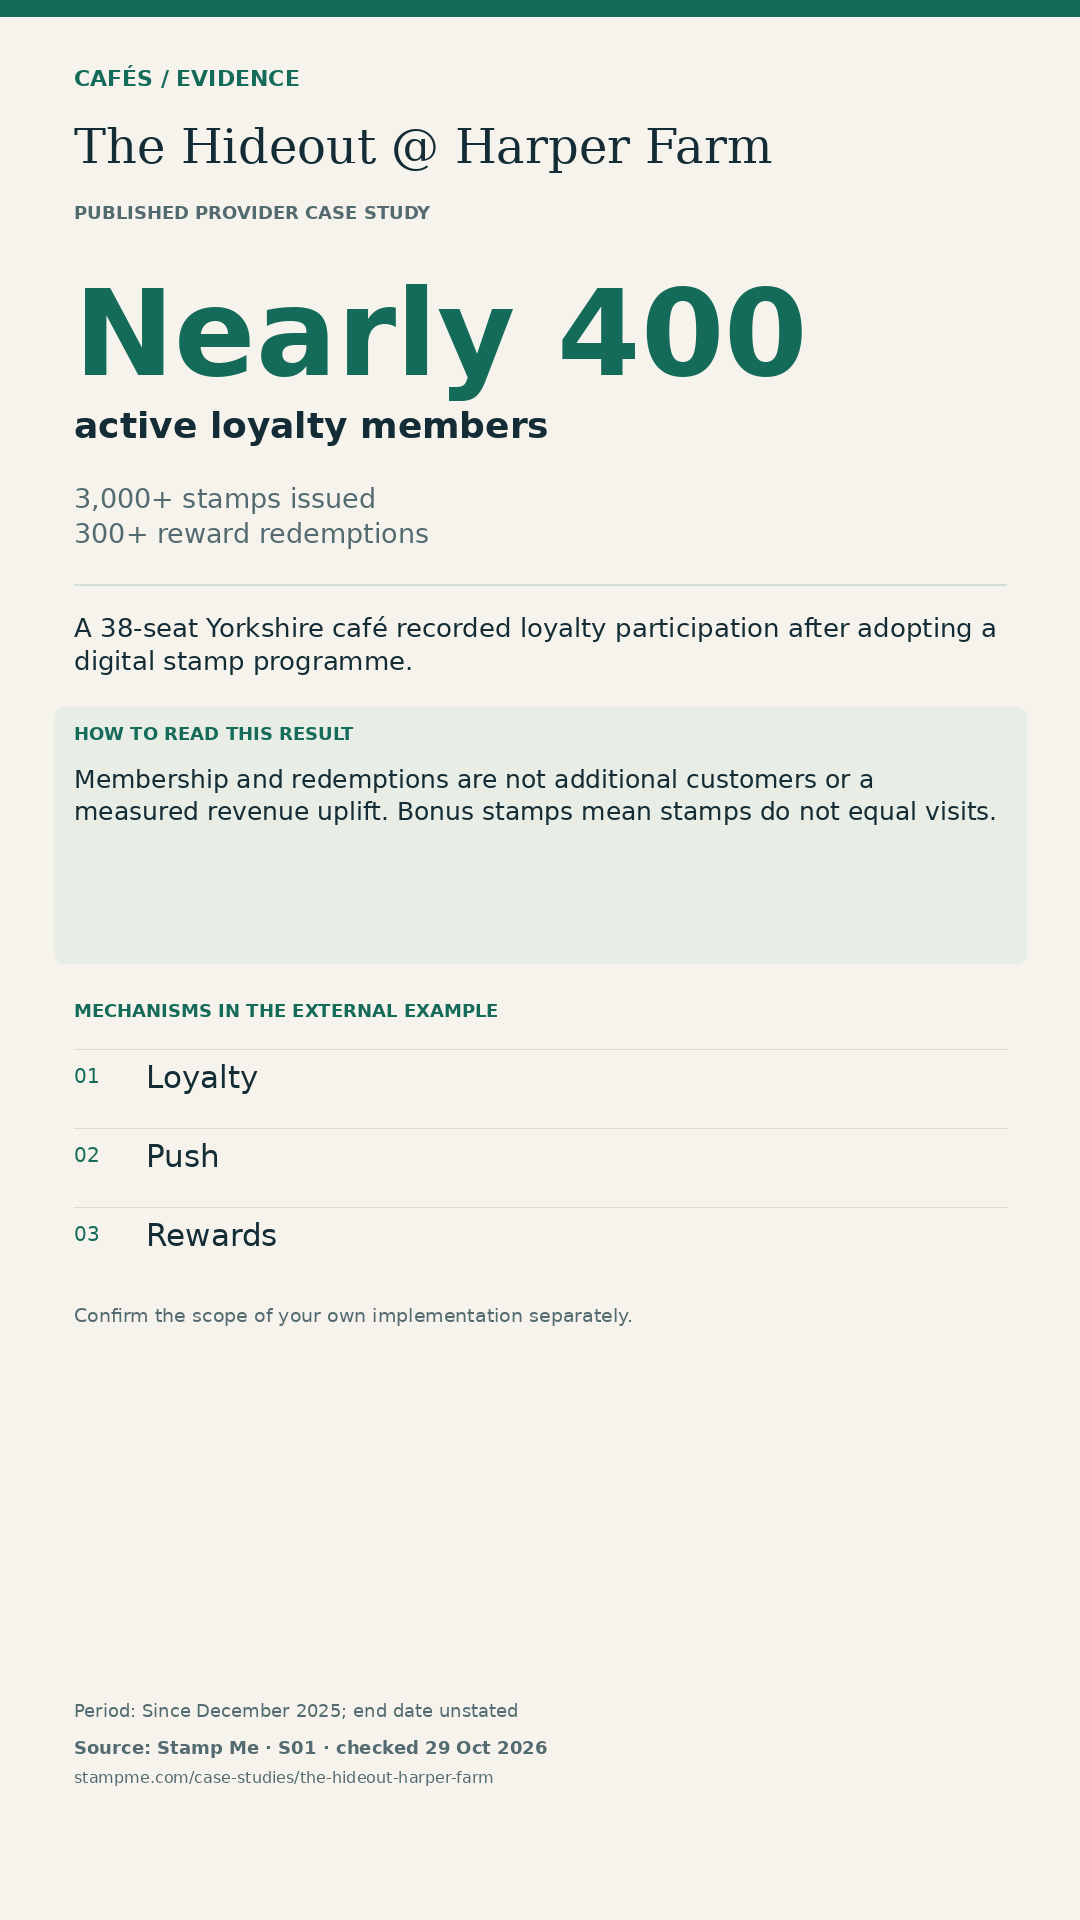
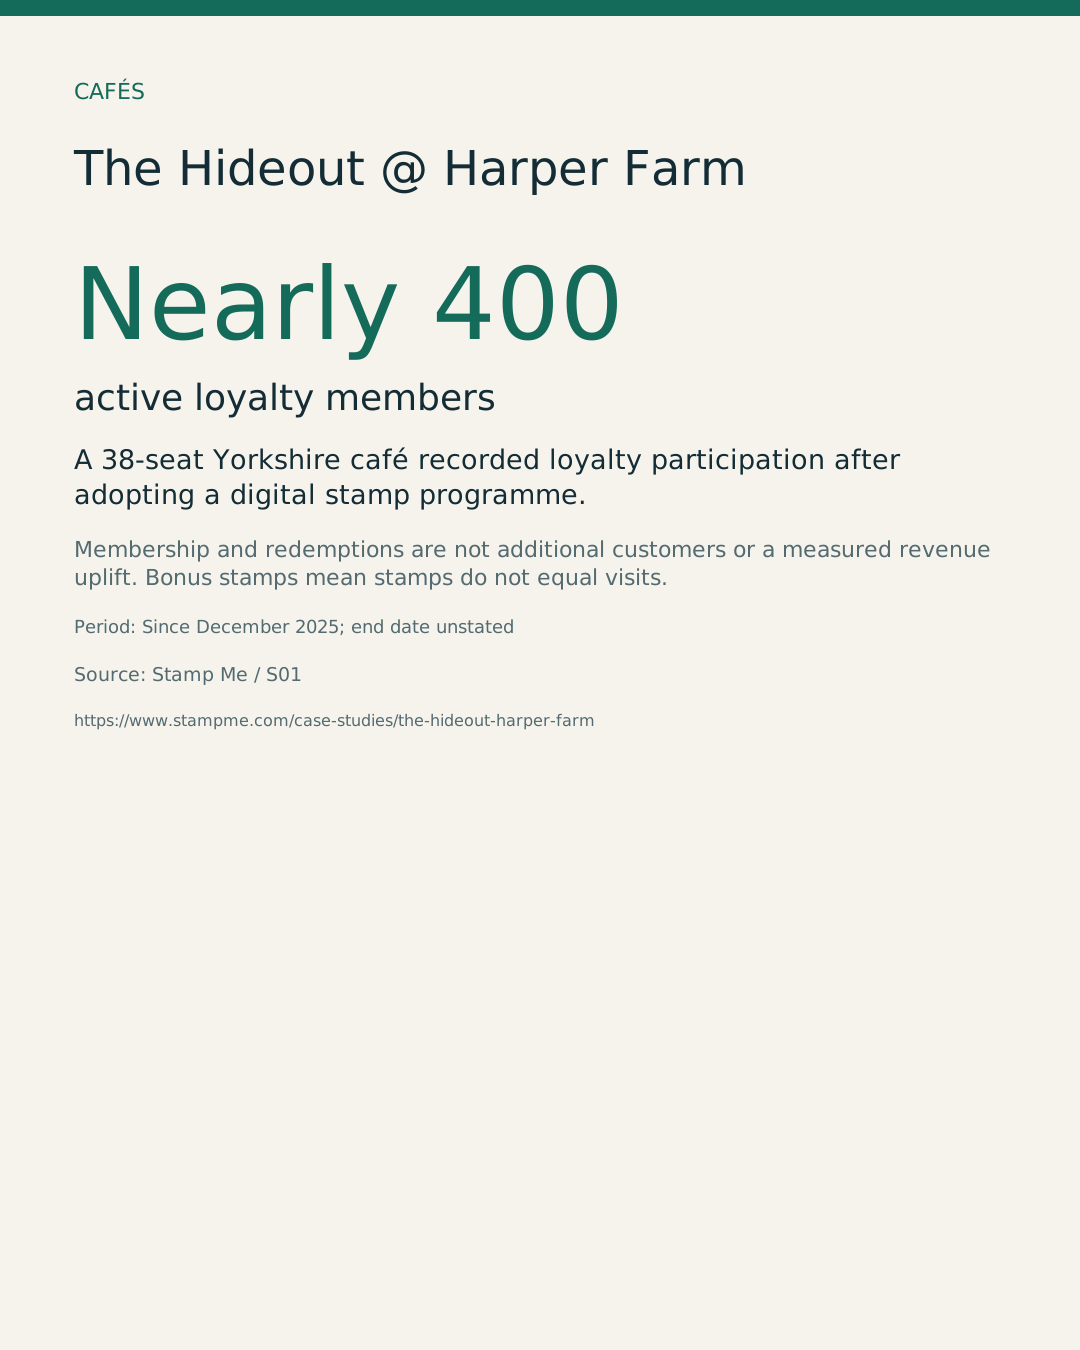
Nearly 400 active loyalty members
Source: Stamp Me. Membership and redemptions are not additional customers or a measured revenue uplift. Bonus stamps mean stamps do not equal visits.
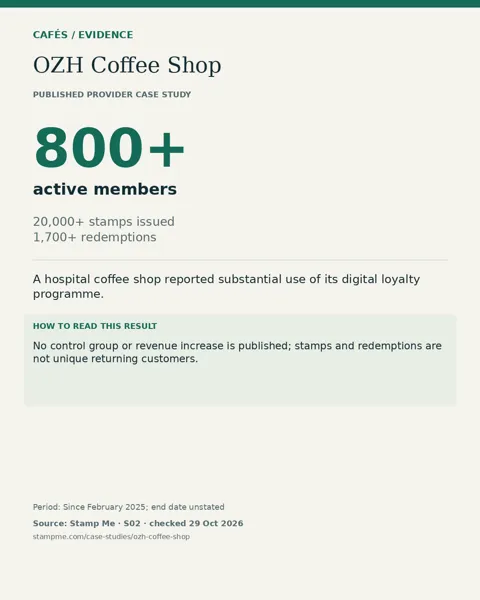
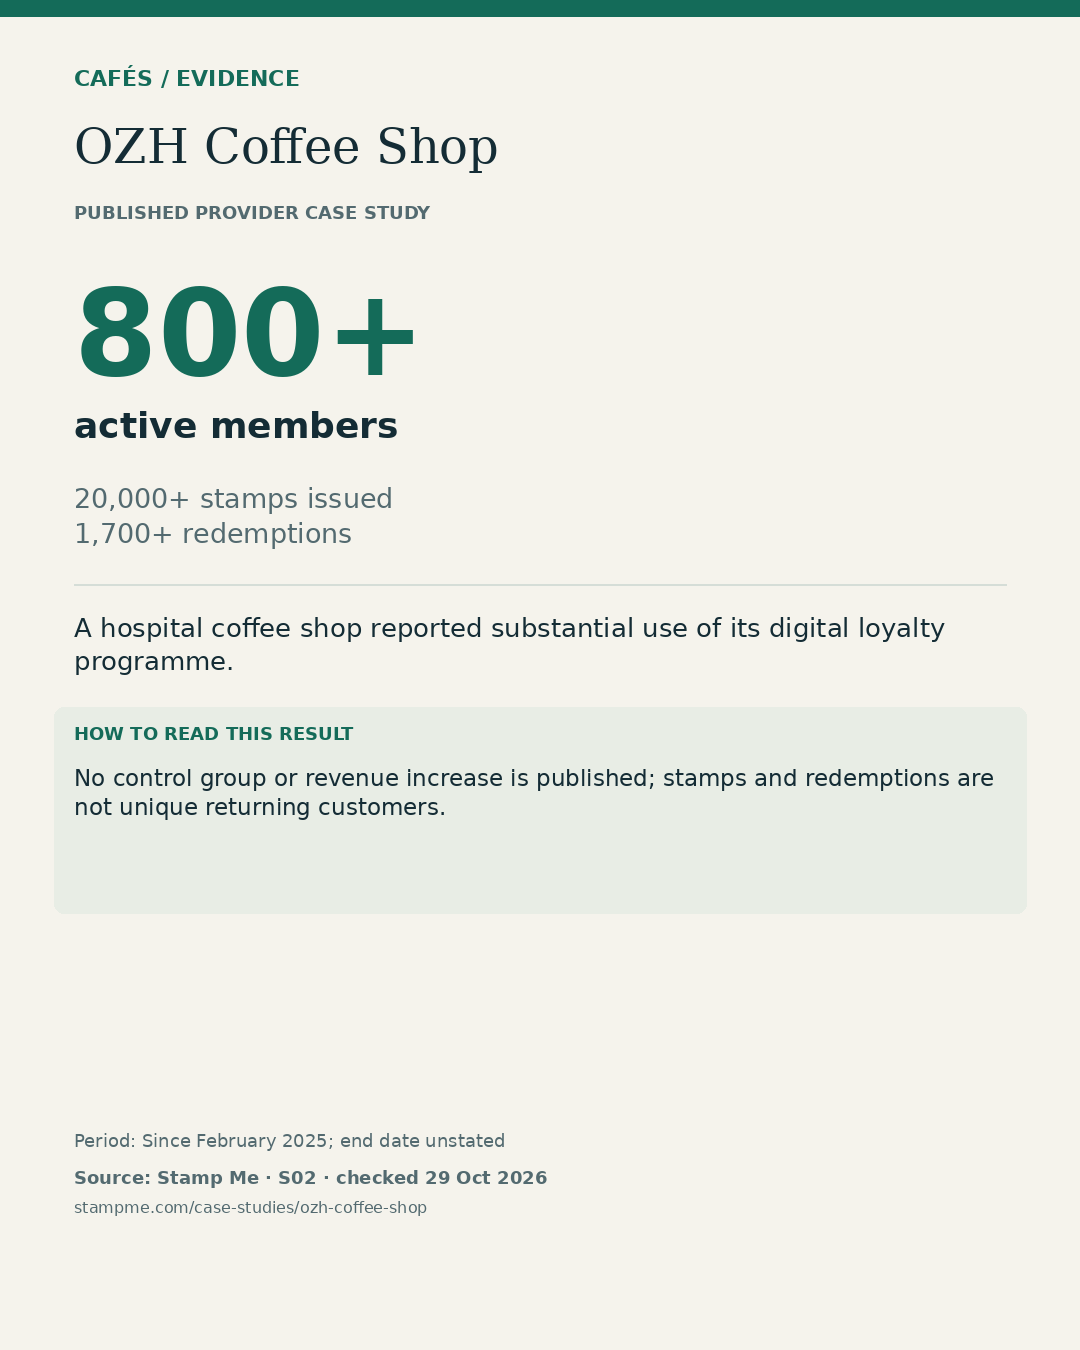
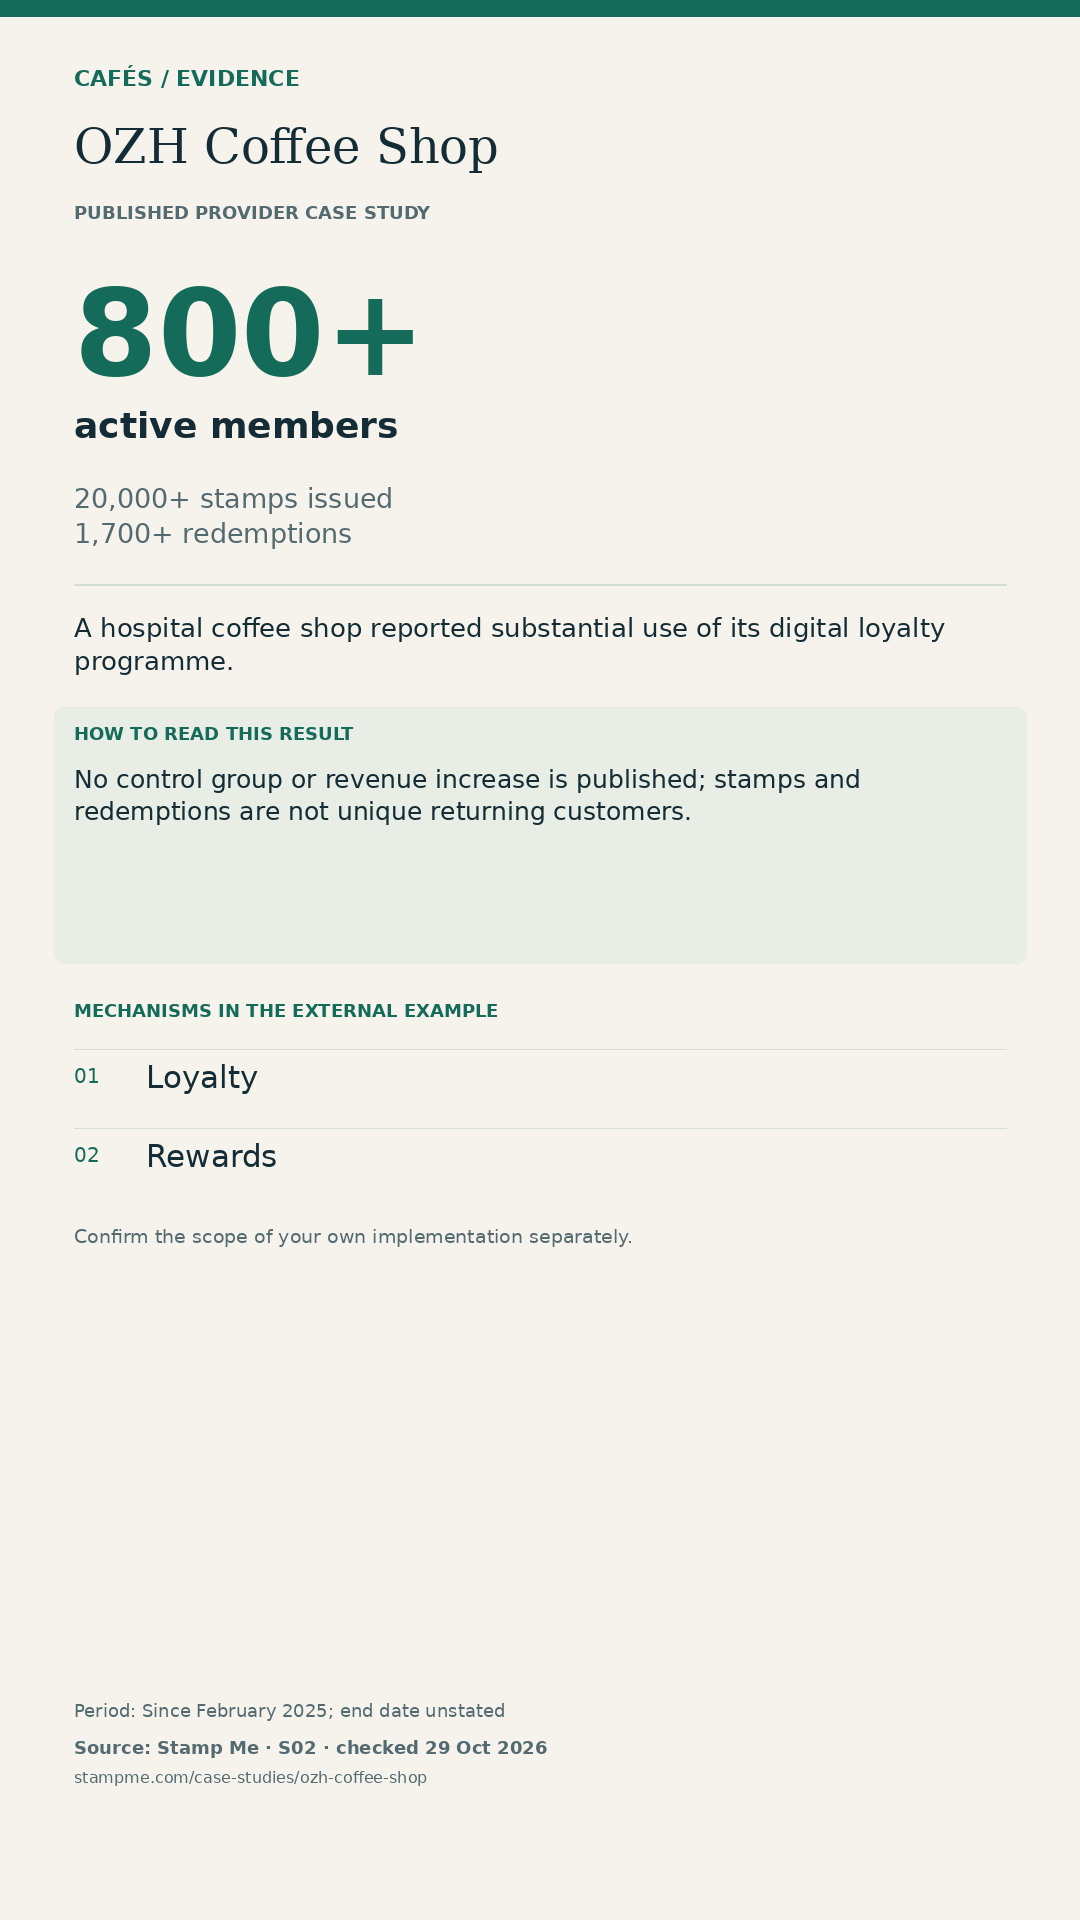
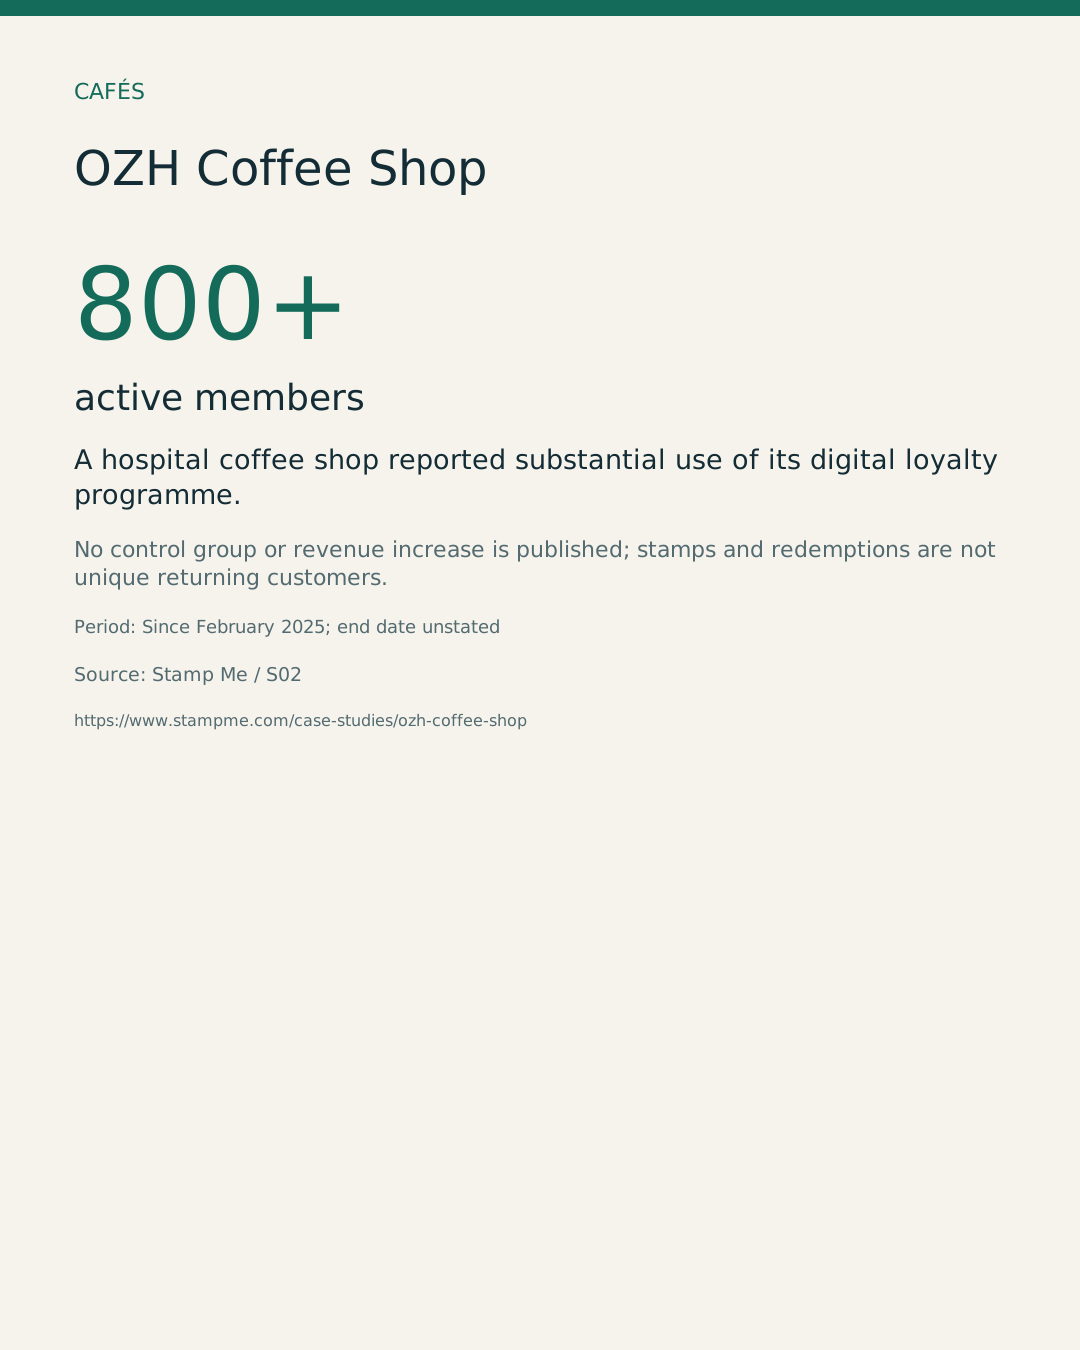
800+ active members
Source: Stamp Me. No control group or revenue increase is published; stamps and redemptions are not unique returning customers.
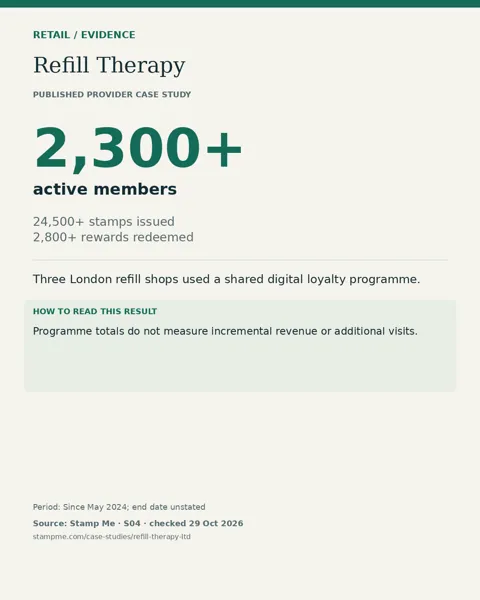
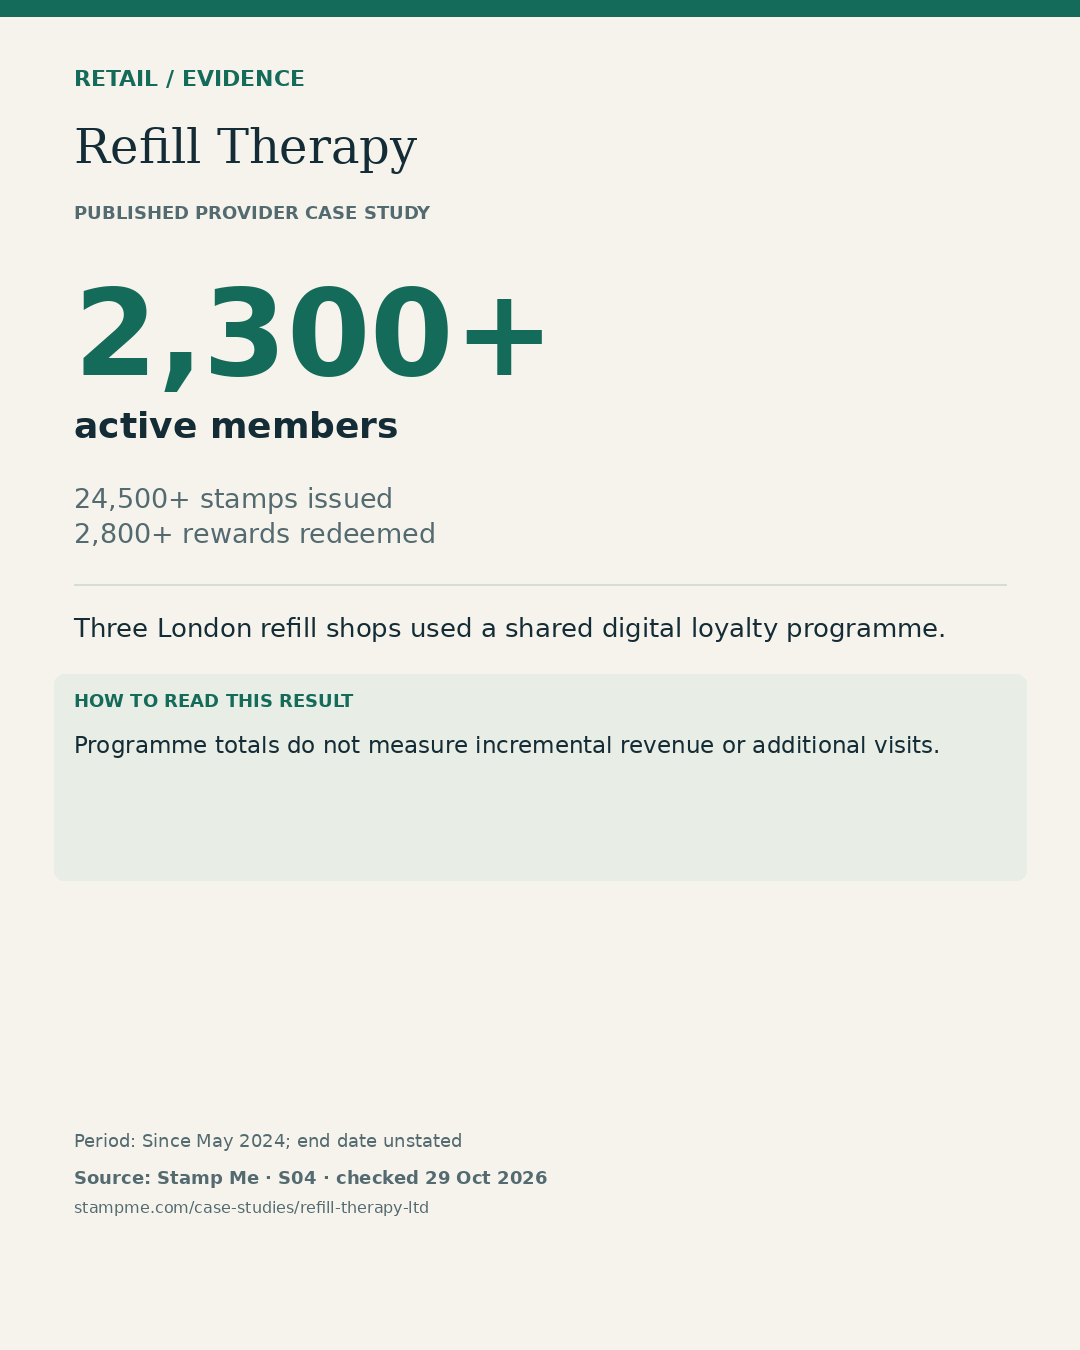
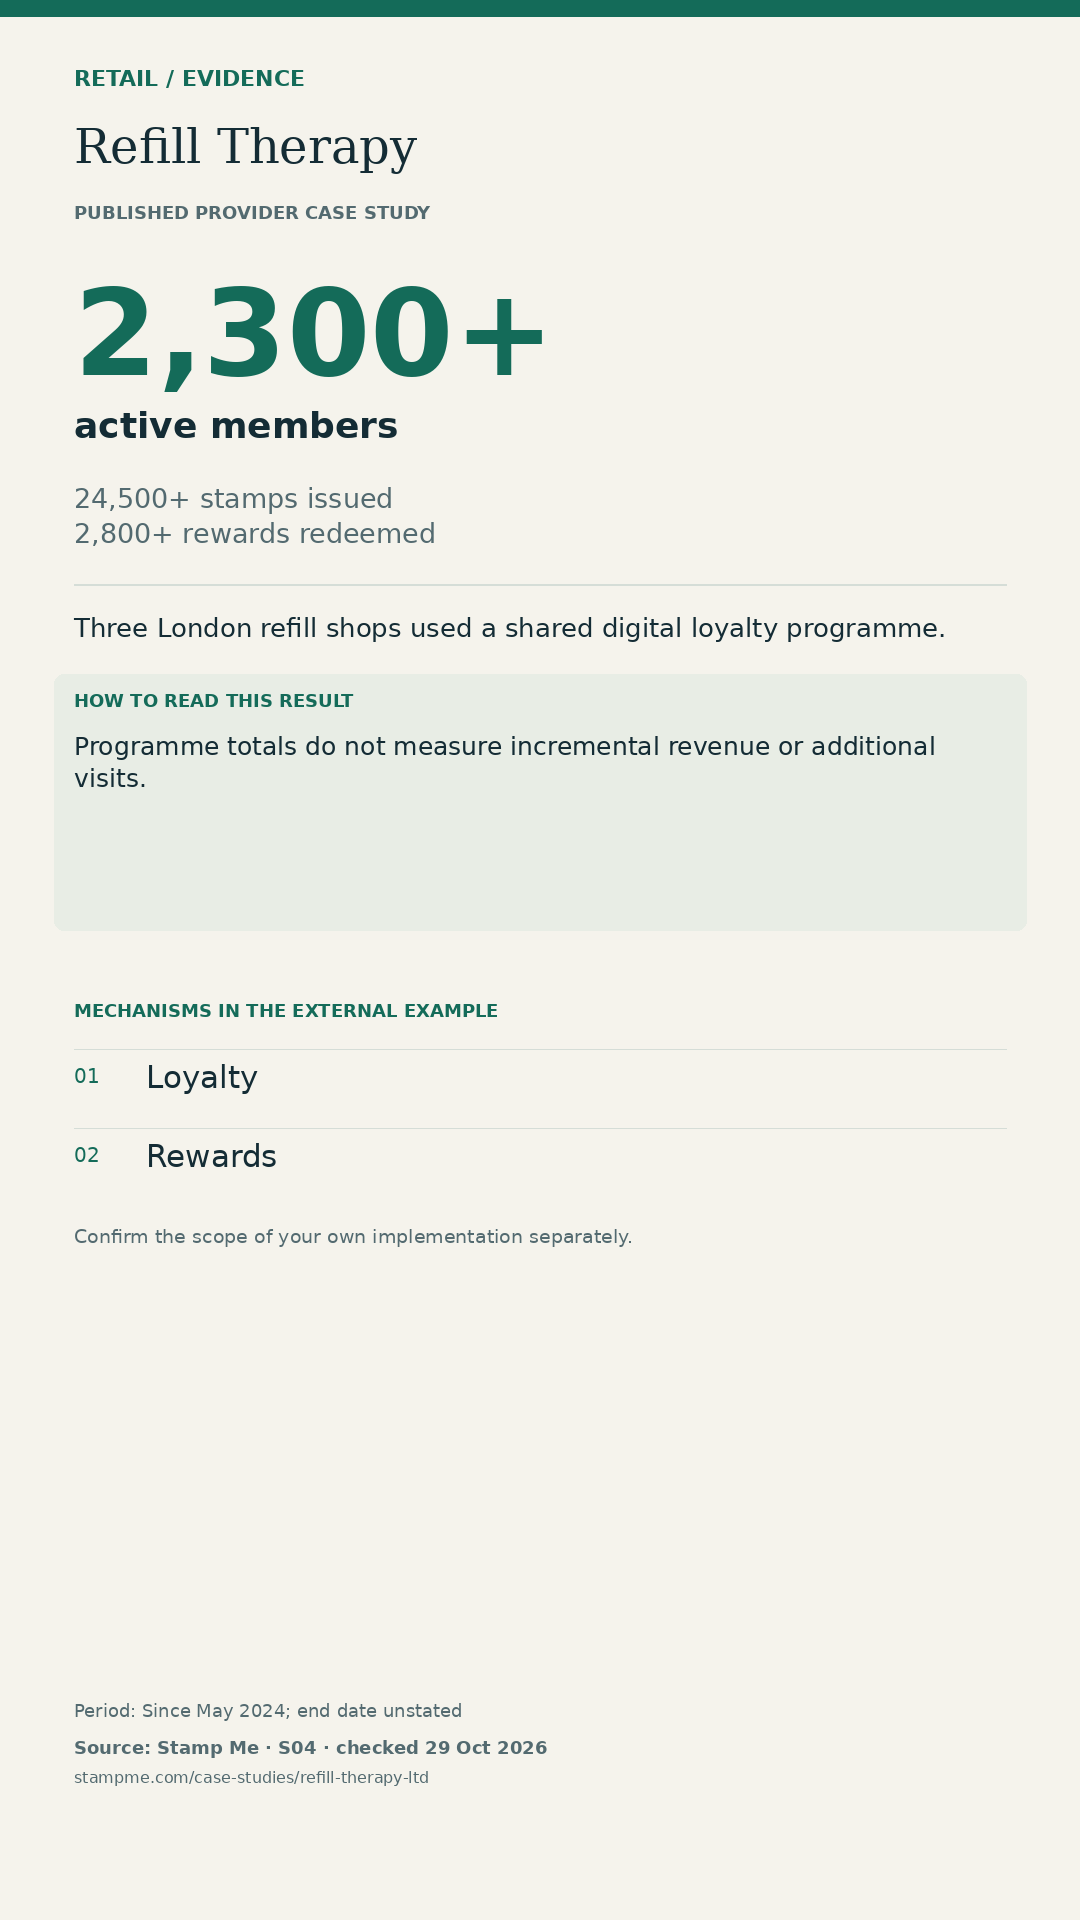
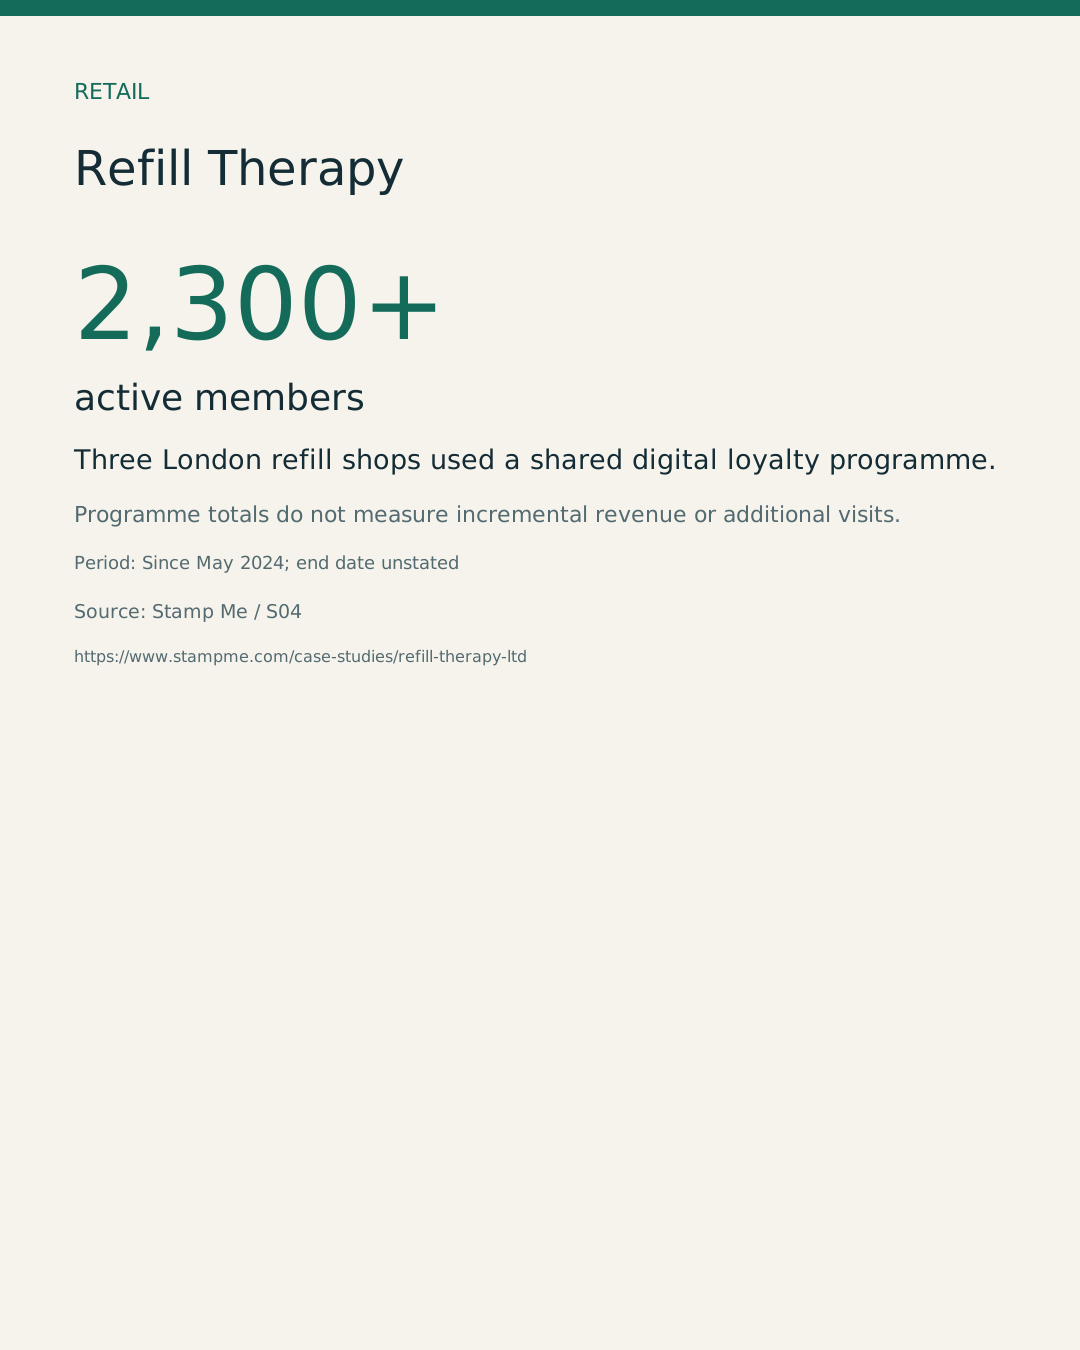
2,300+ active members
Source: Stamp Me. Programme totals do not measure incremental revenue or additional visits.
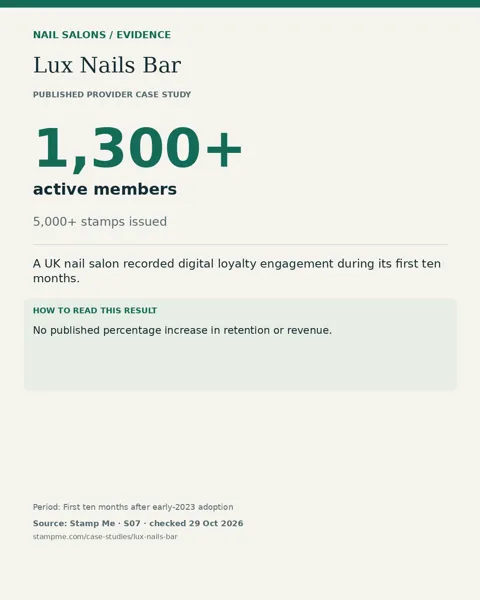
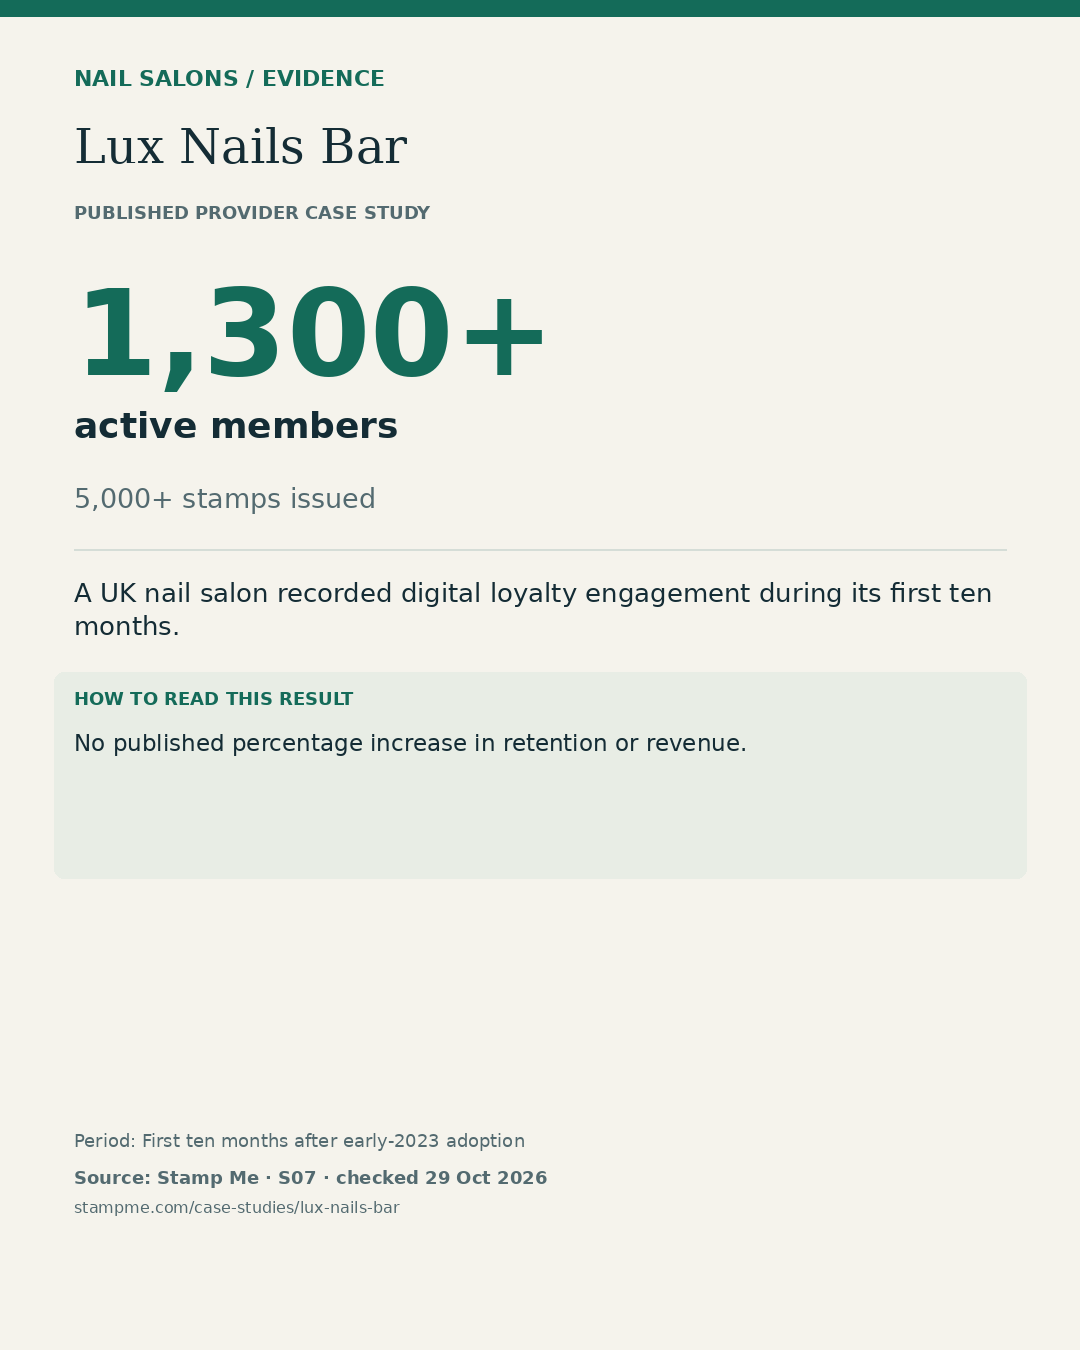
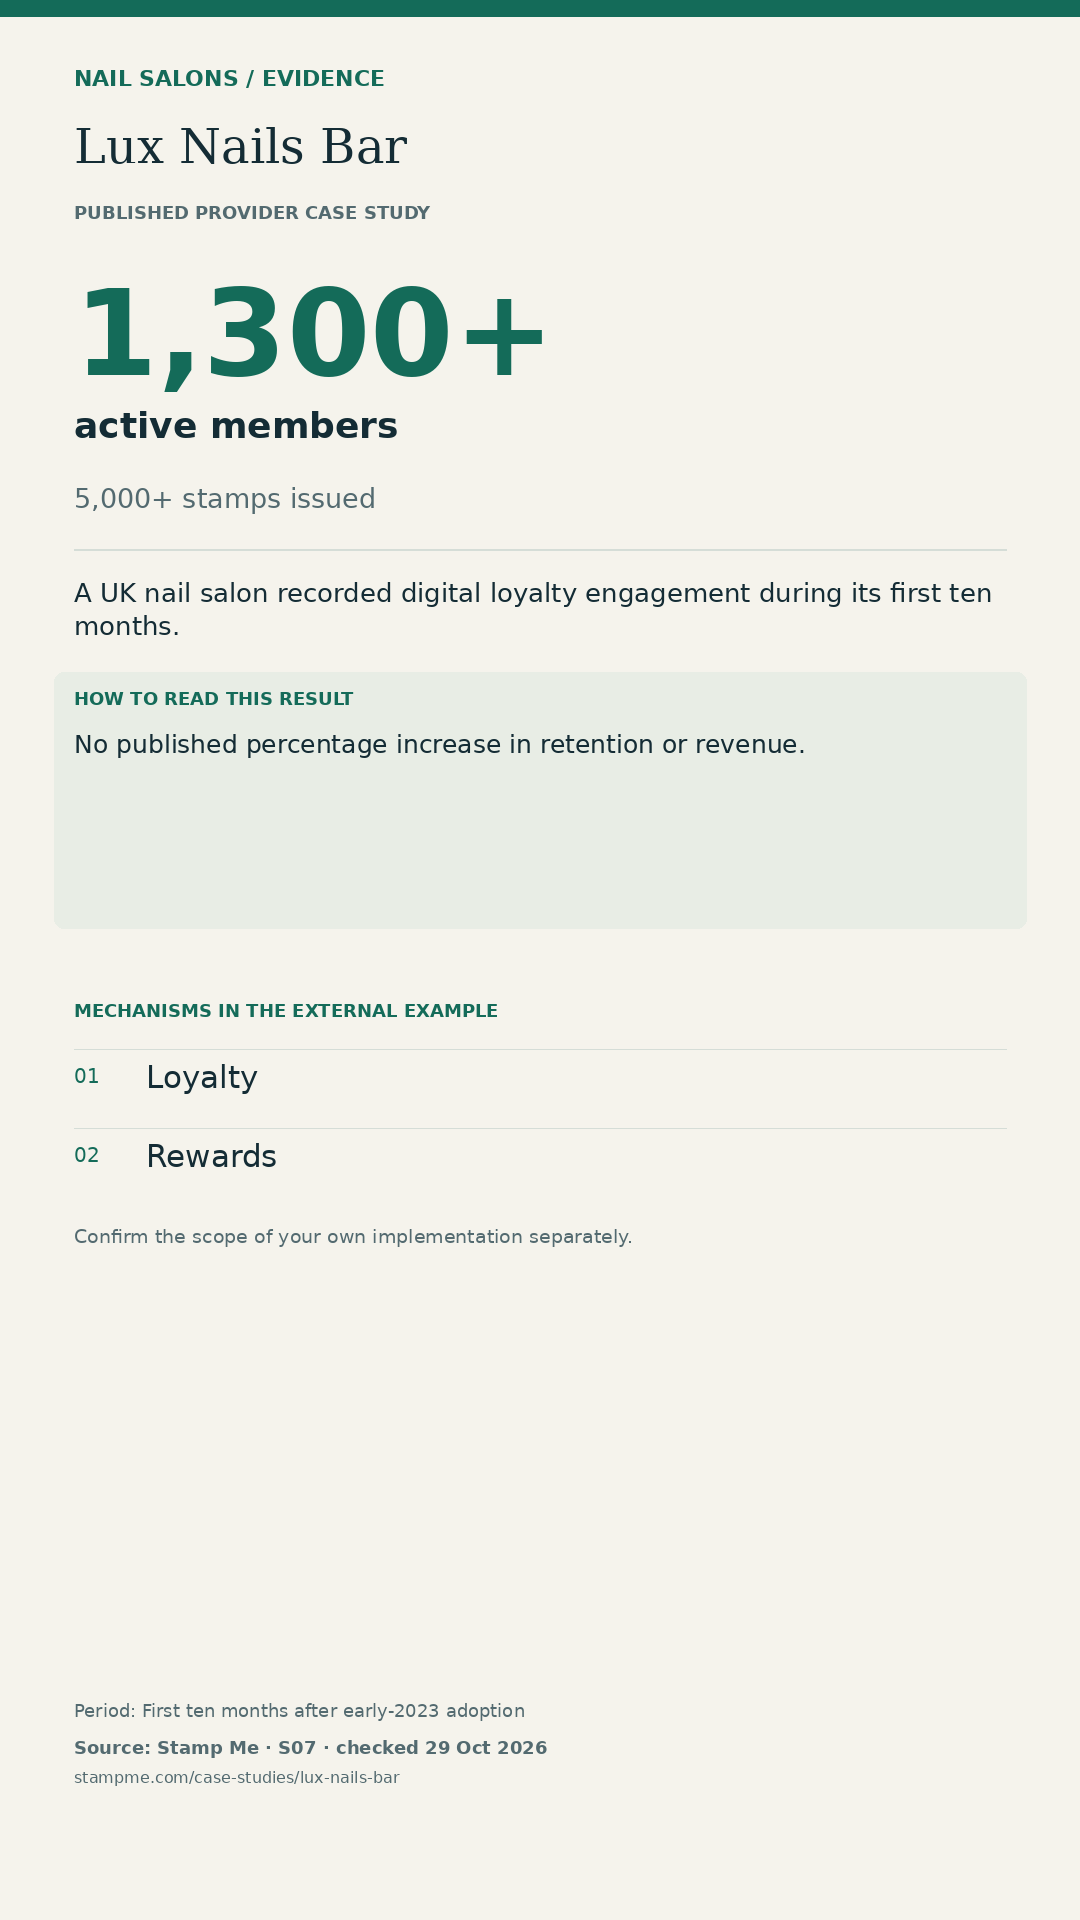
1,300+ active members
Source: Stamp Me. No published percentage increase in retention or revenue.
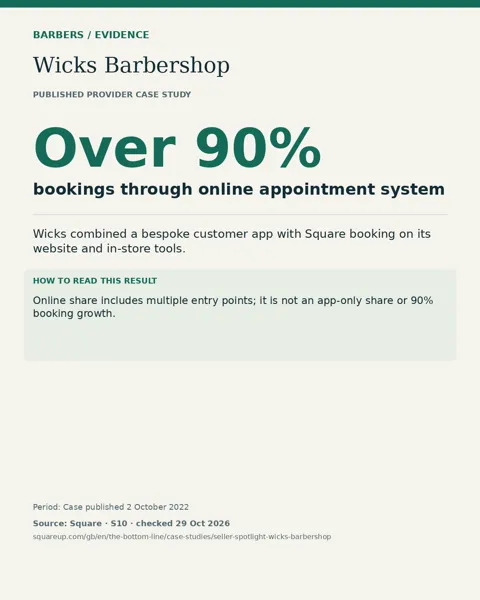
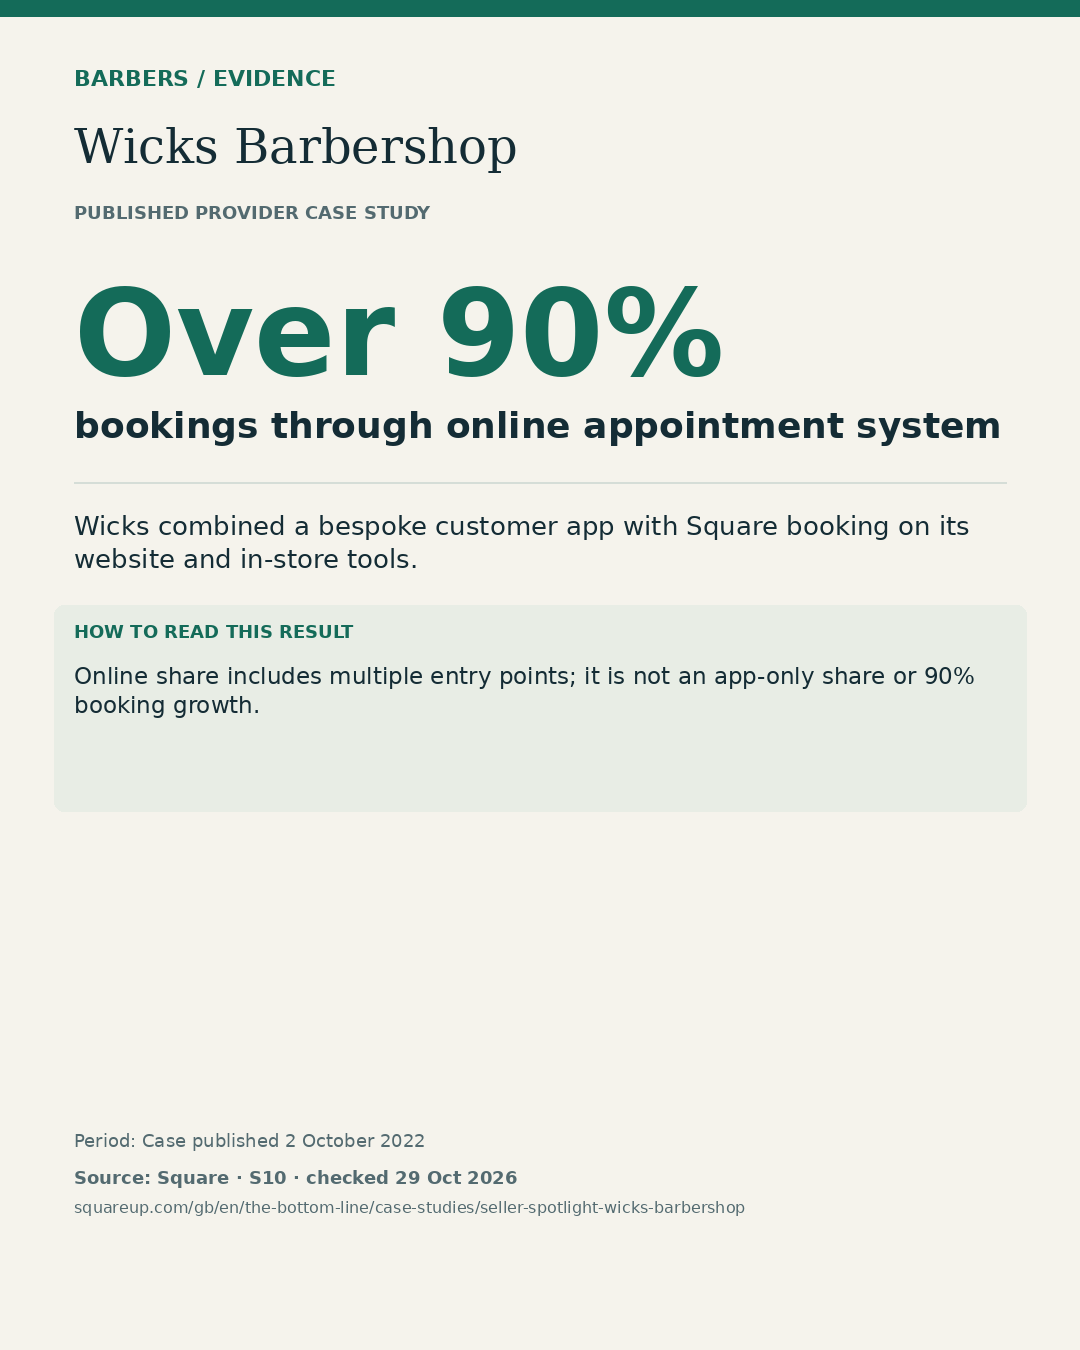
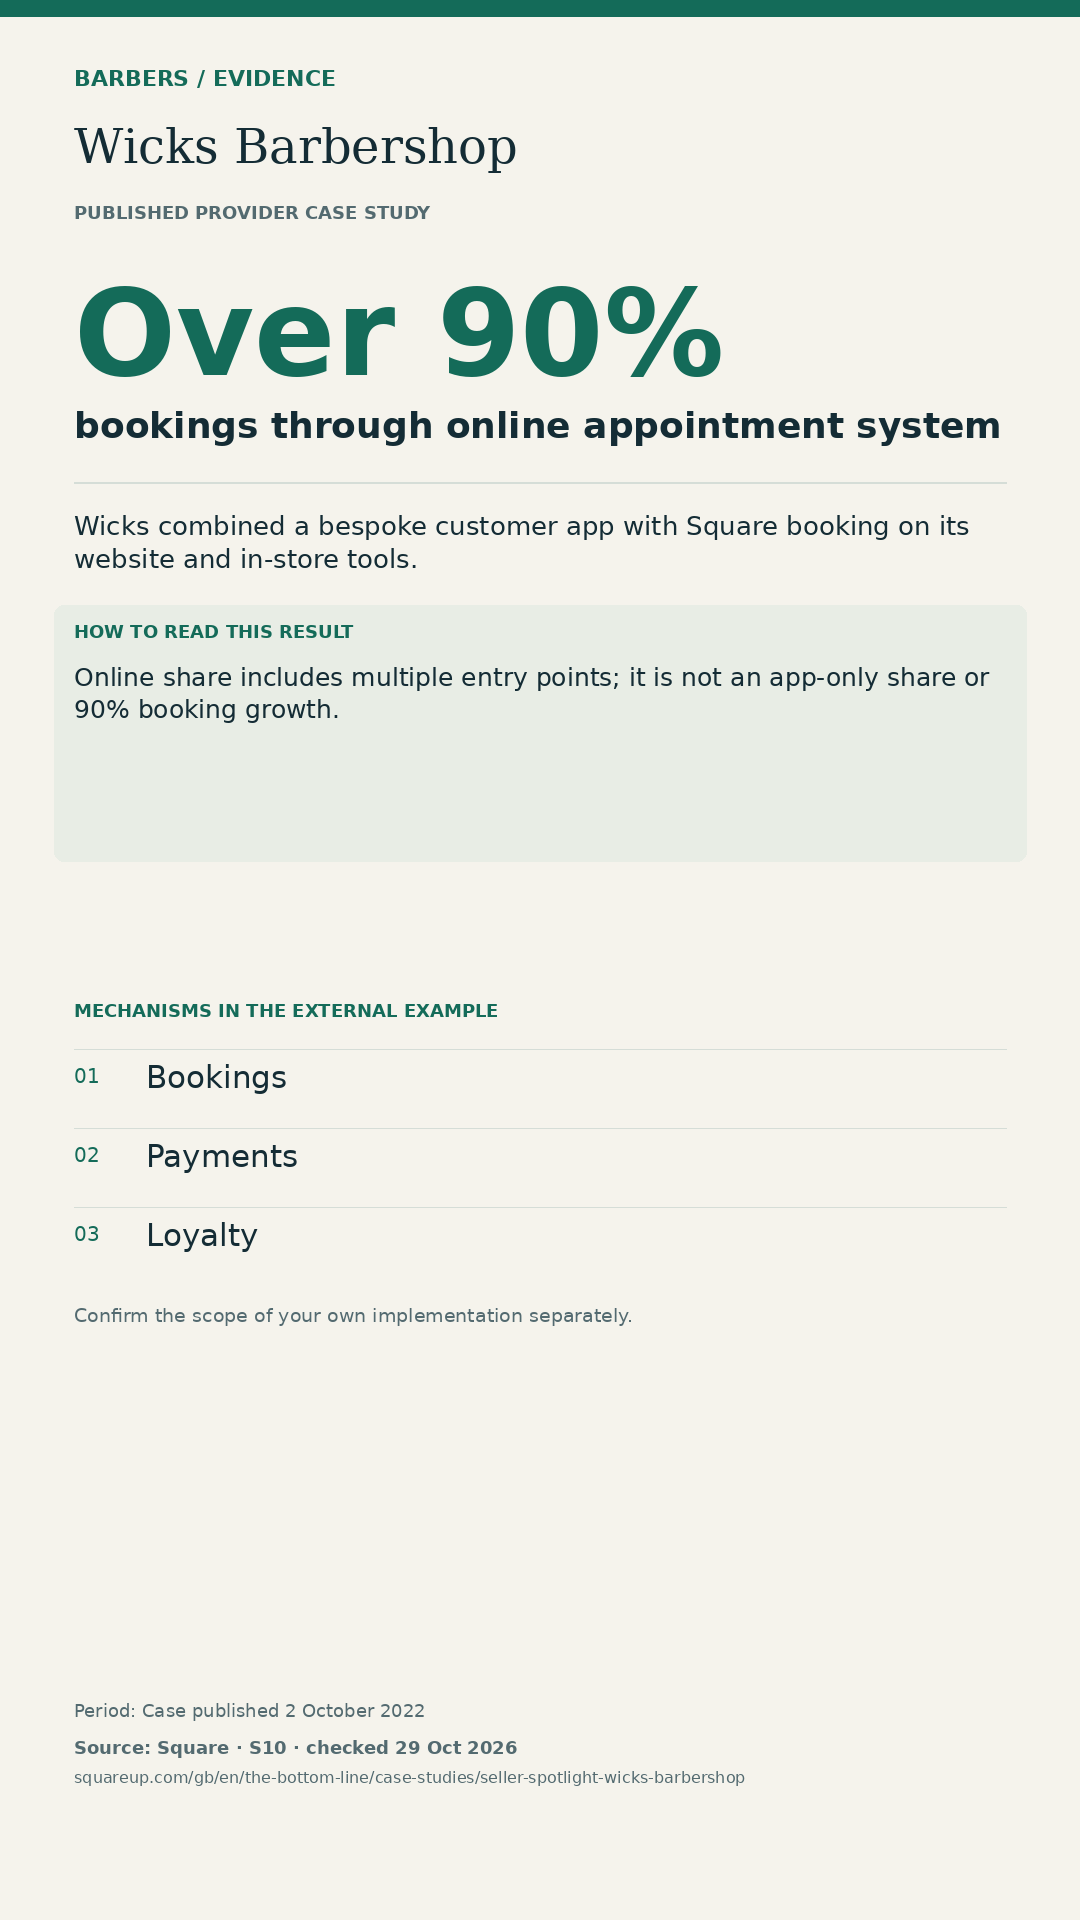
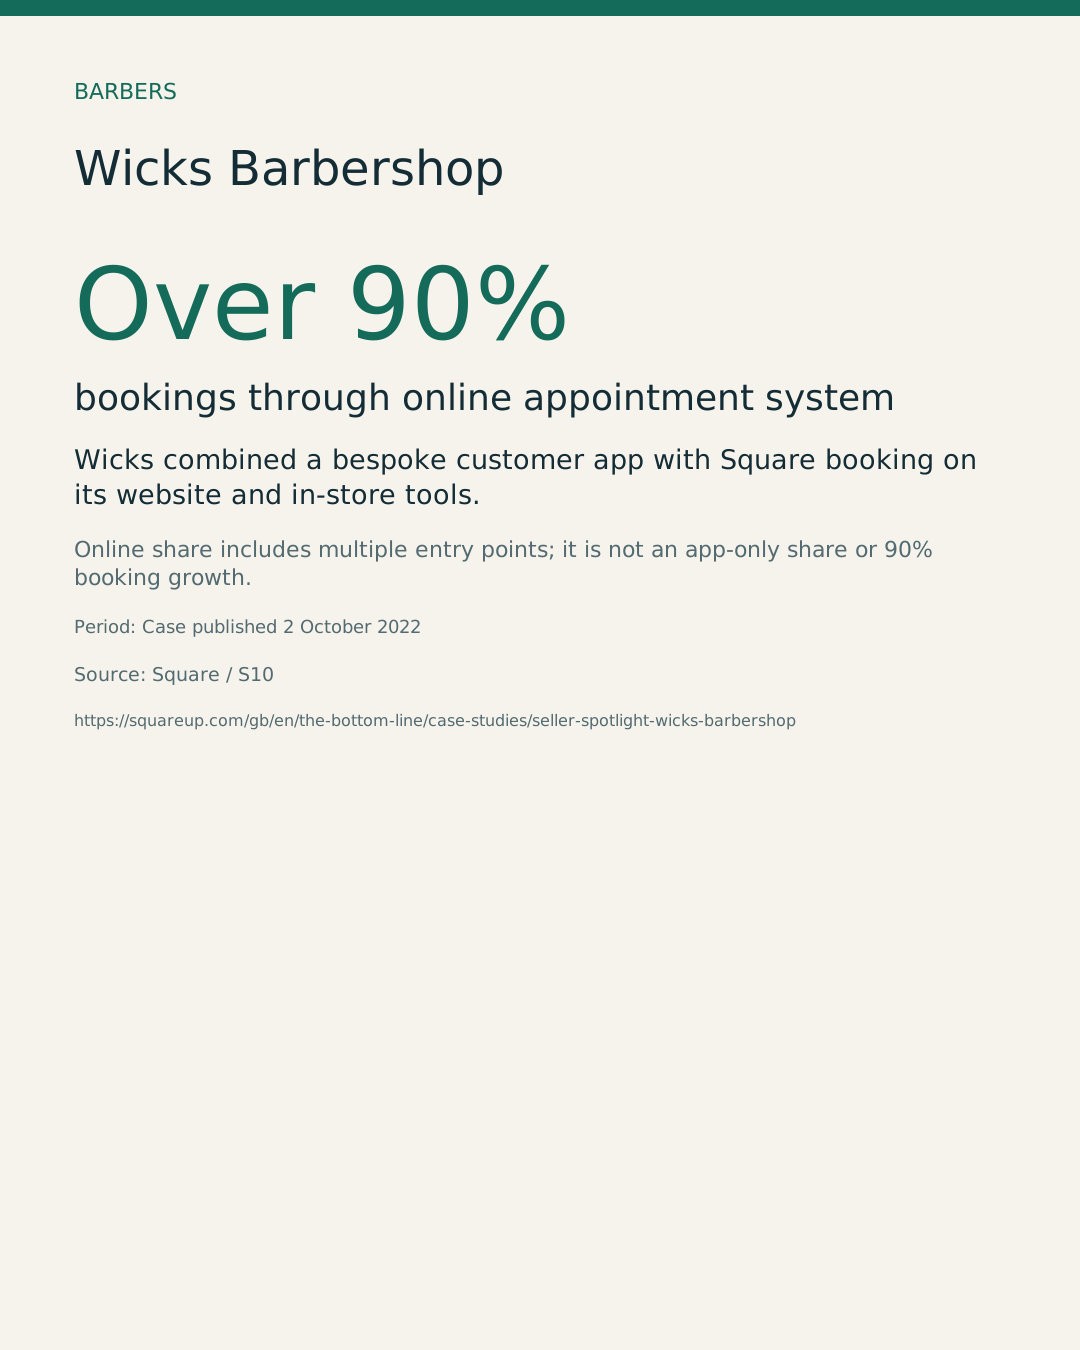
Over 90% bookings through online appointment system
Source: Square. Online share includes multiple entry points; it is not an app-only share or 90% booking growth.
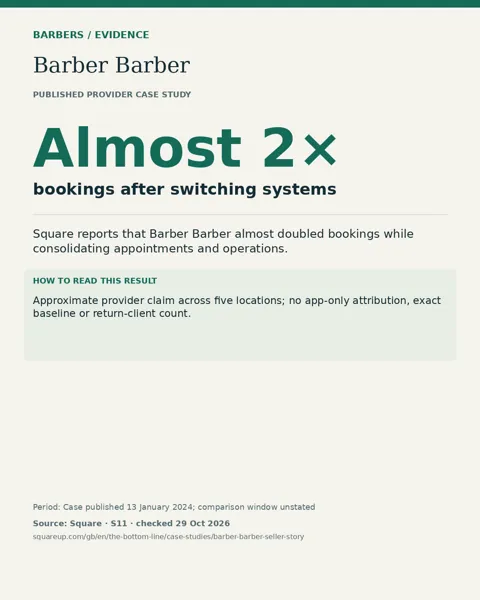
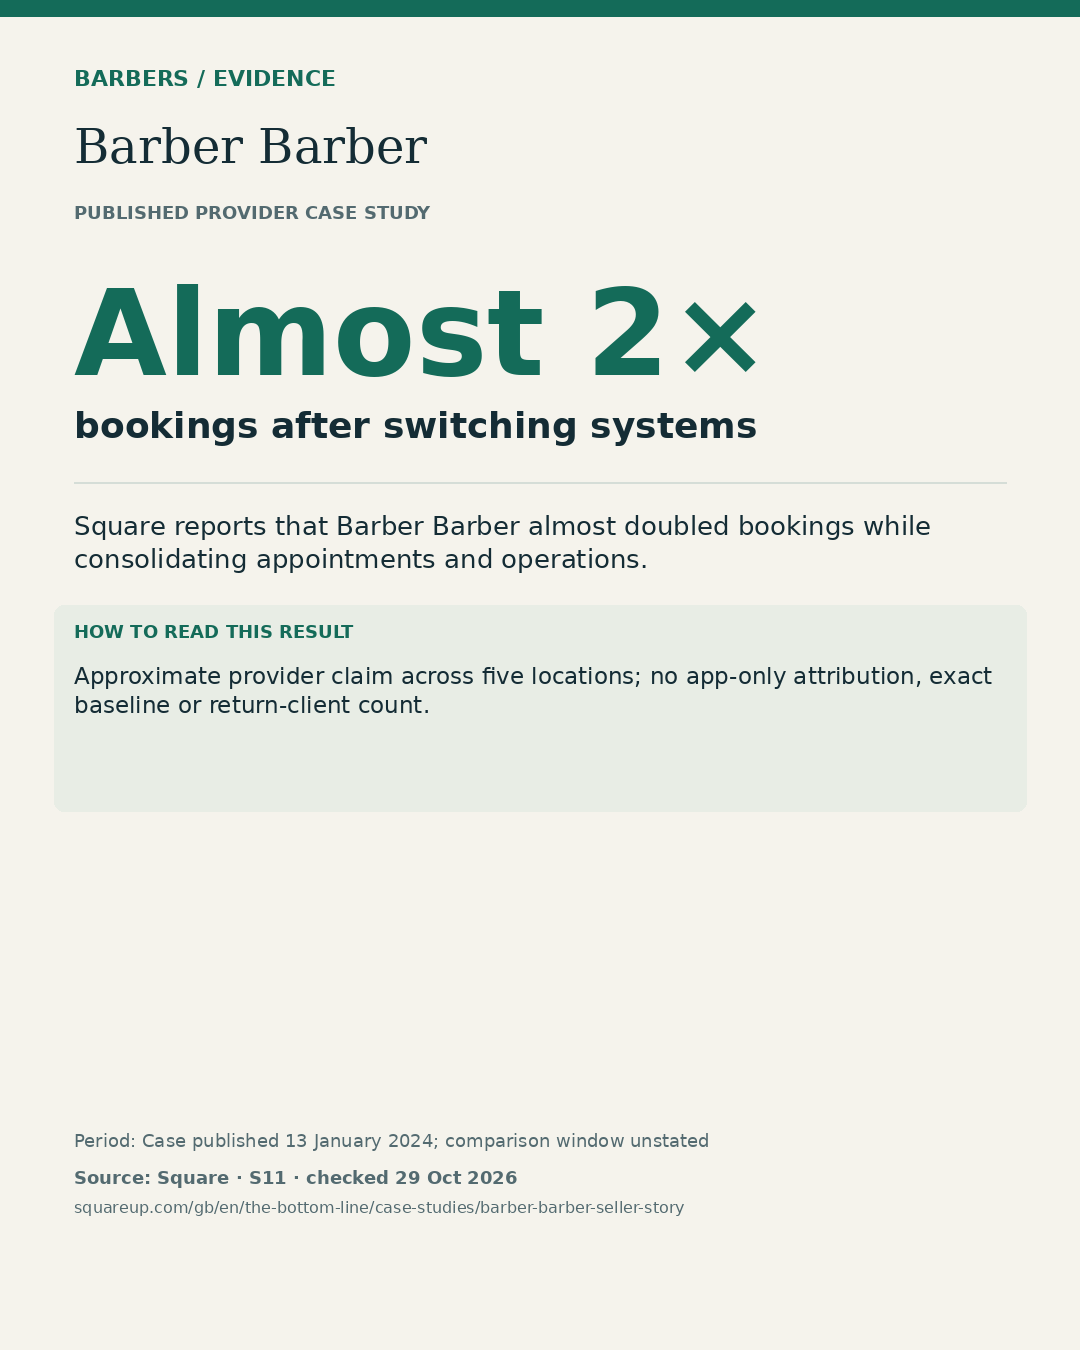
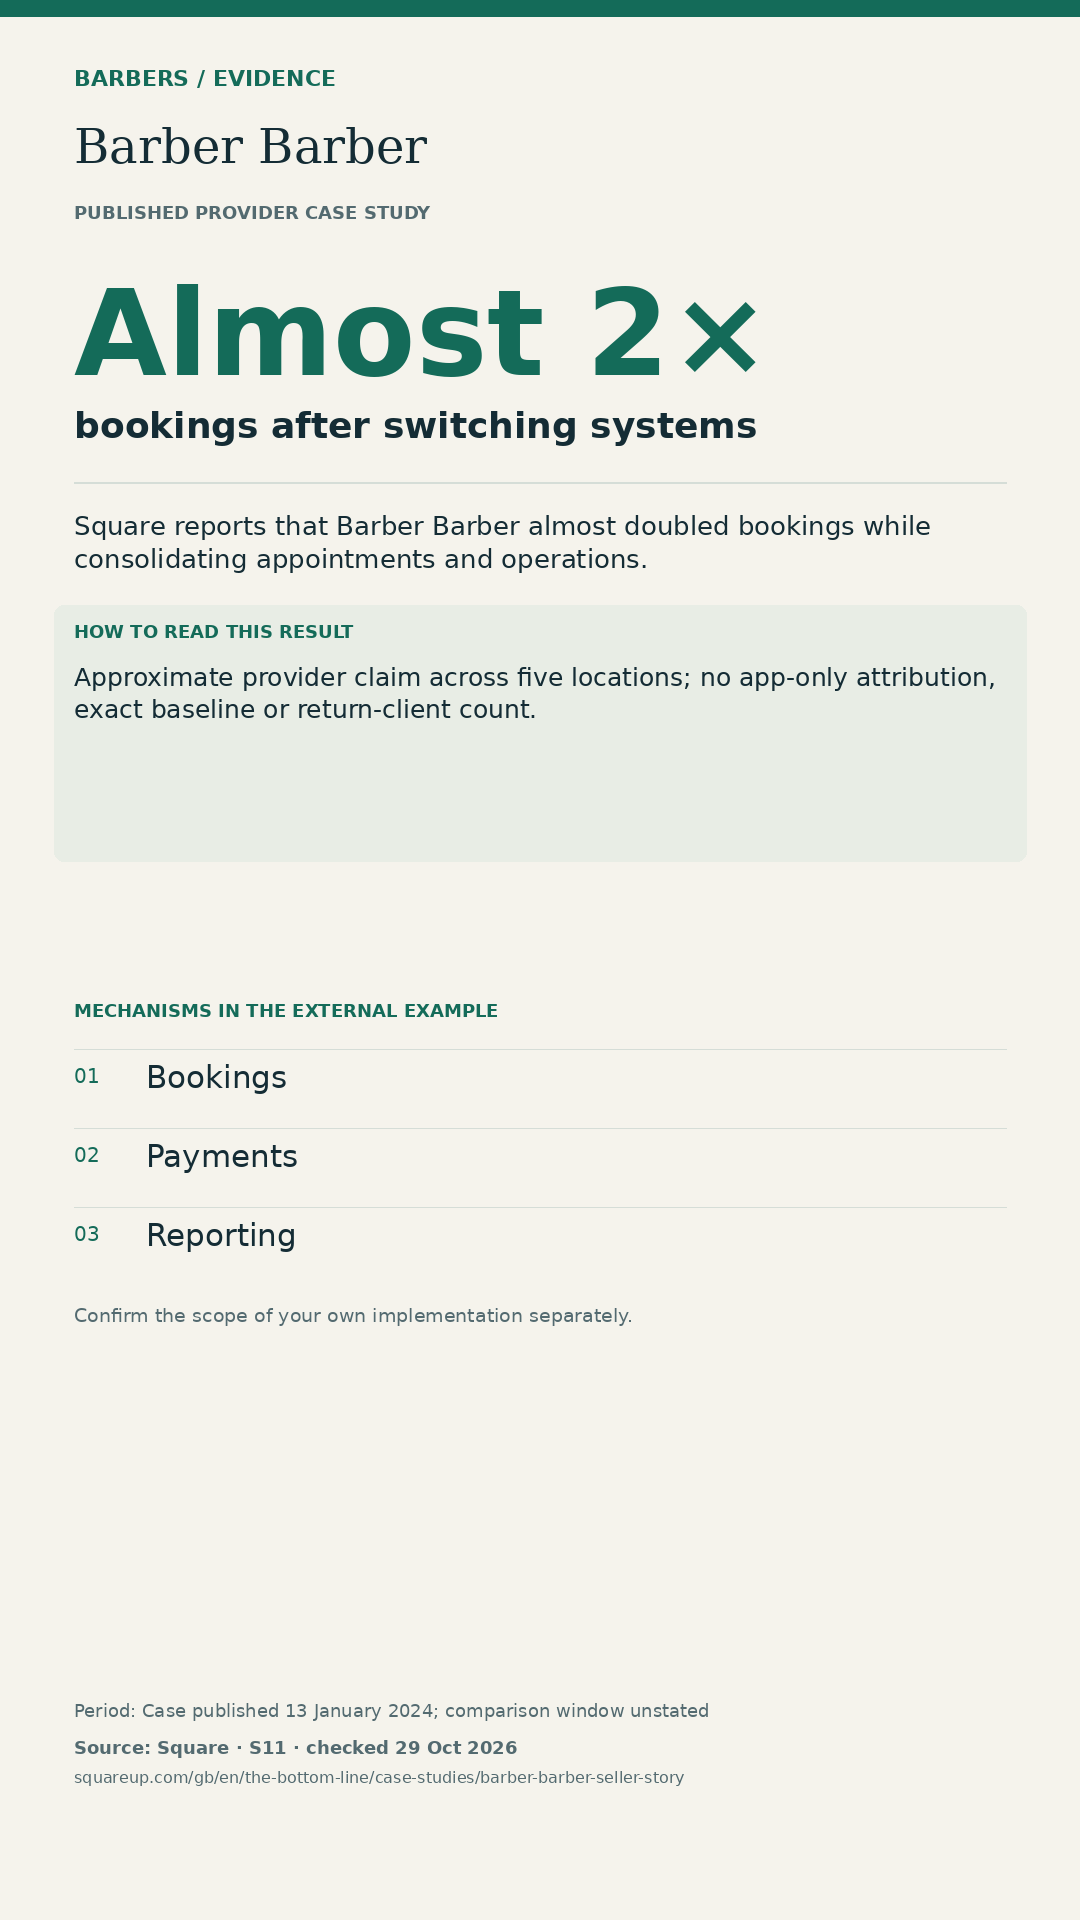
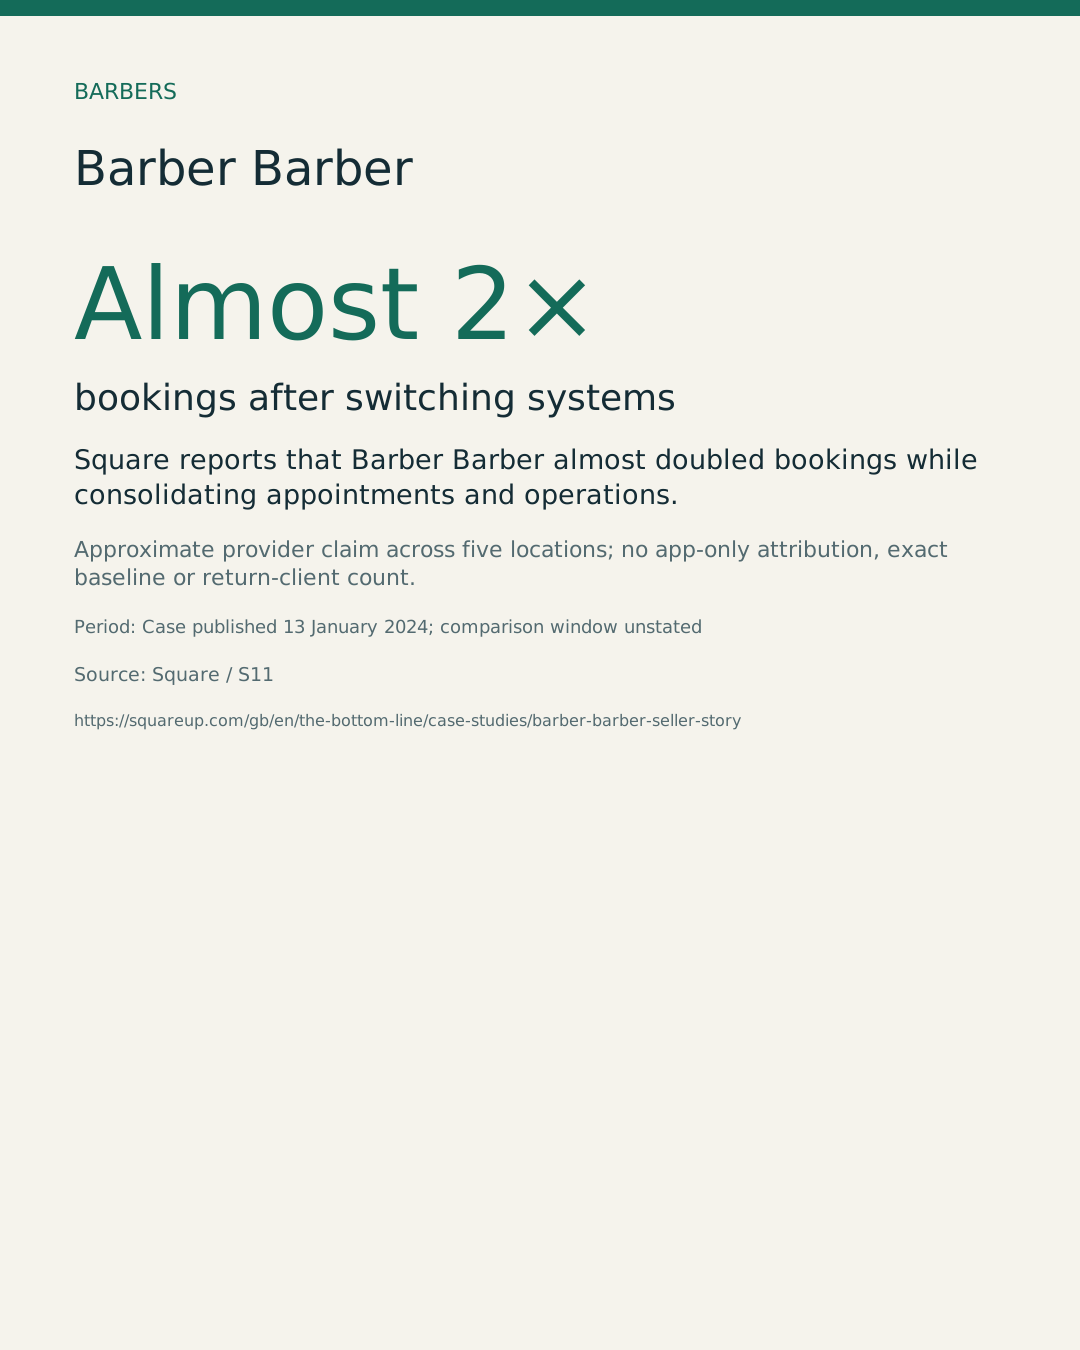
Almost 2× bookings after switching systems
Source: Square. Approximate provider claim across five locations; no app-only attribution, exact baseline or return-client count.
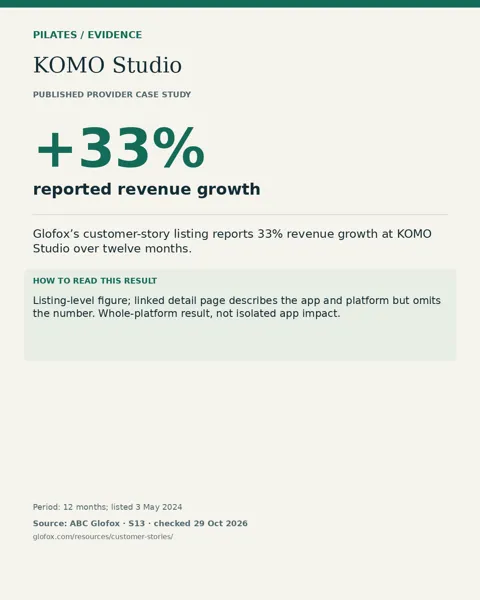
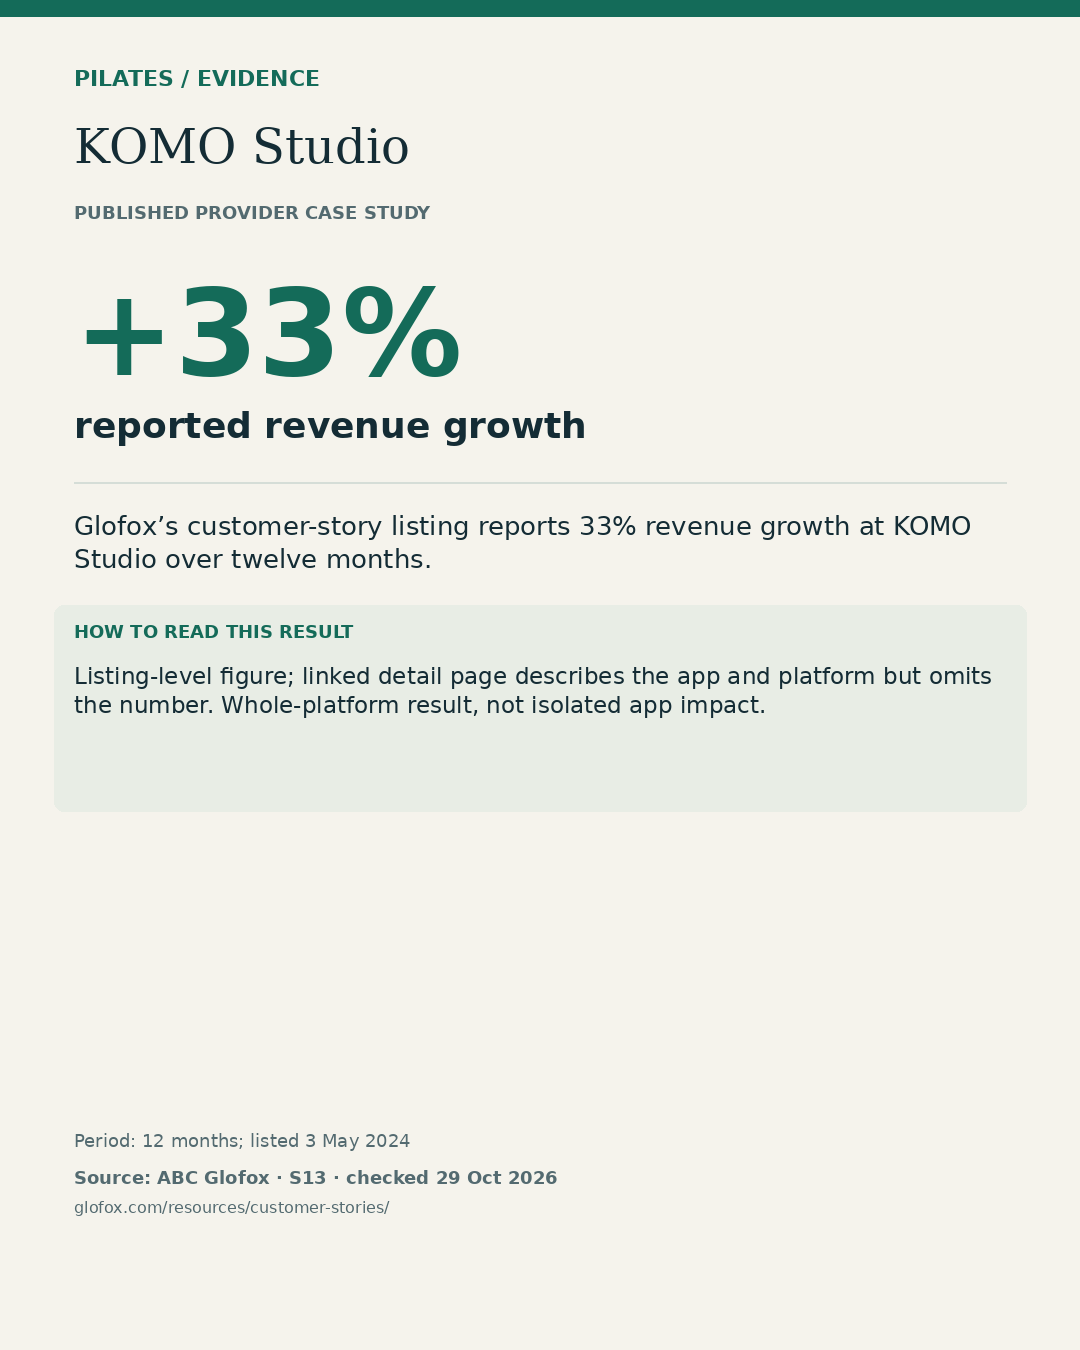
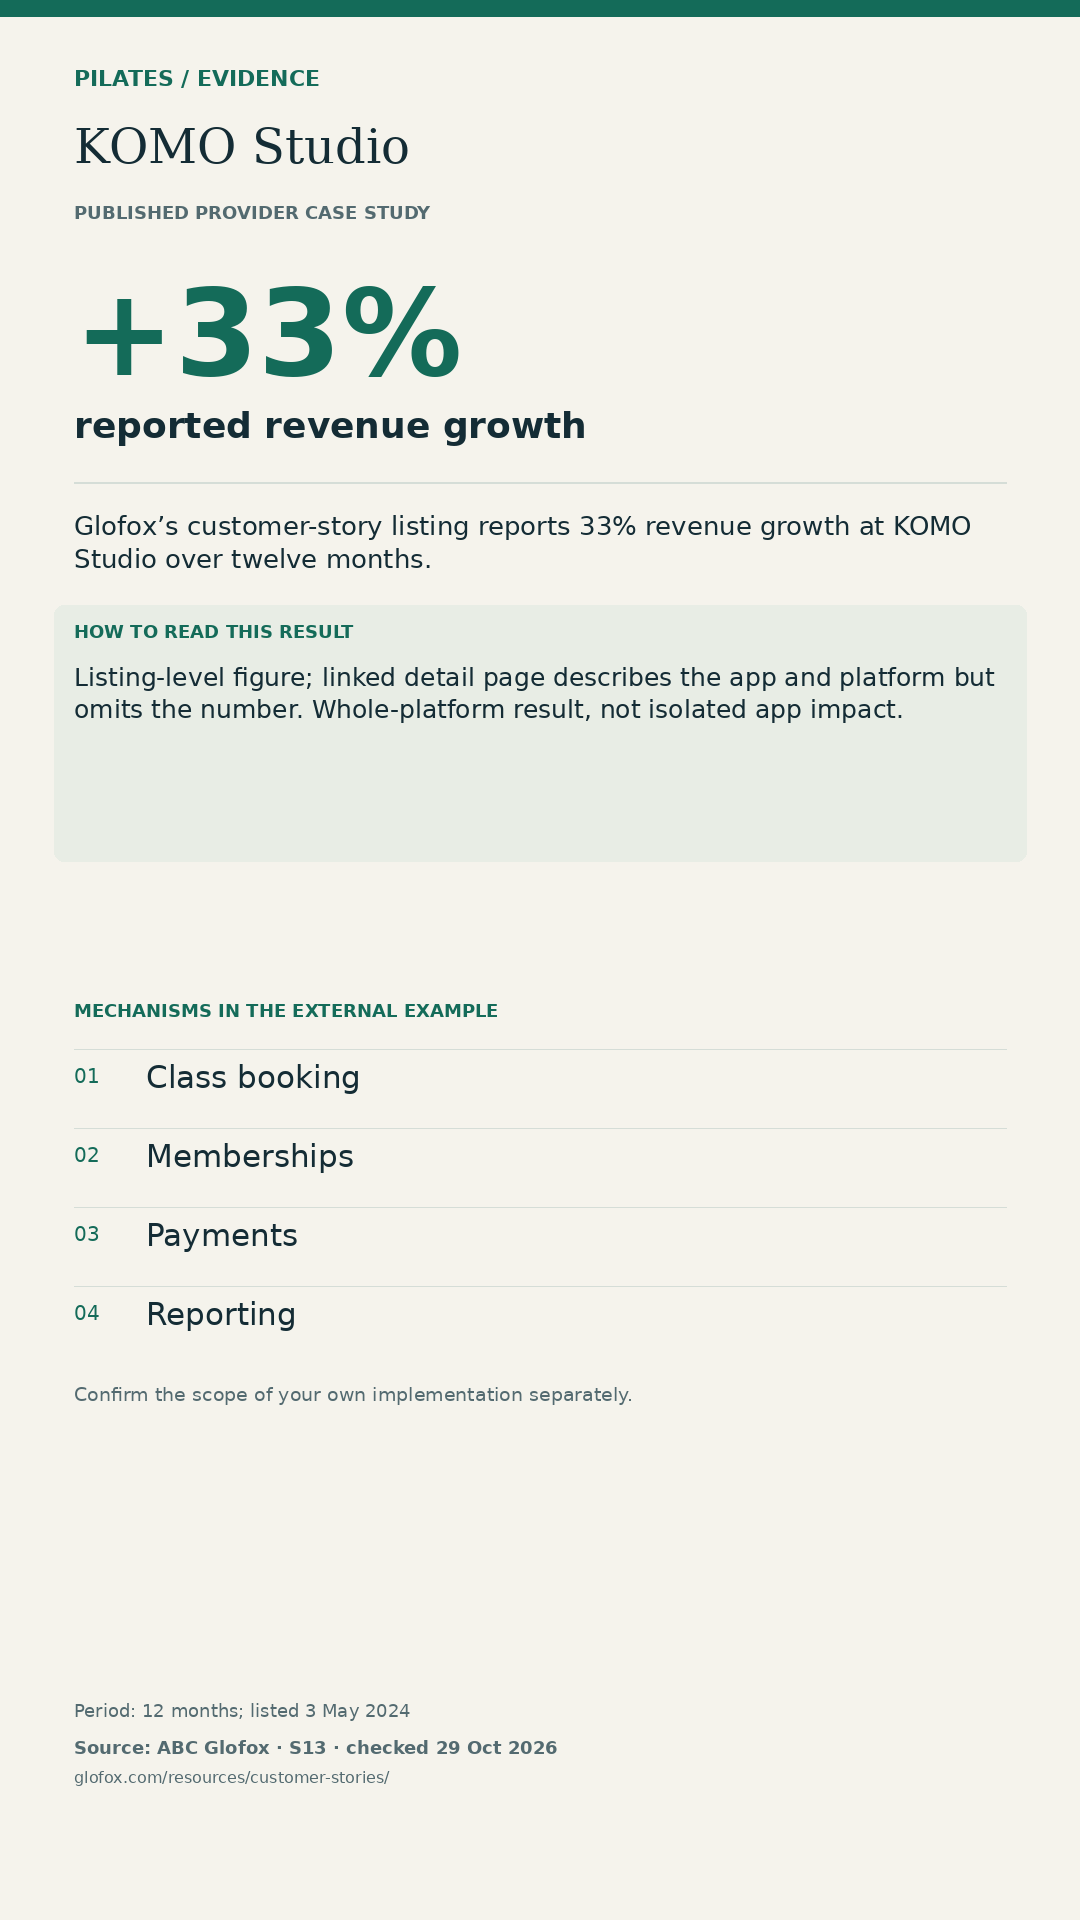
+33% reported revenue growth
Source: ABC Glofox. Listing-level figure; linked detail page describes the app and platform but omits the number. Whole-platform result, not isolated app impact.
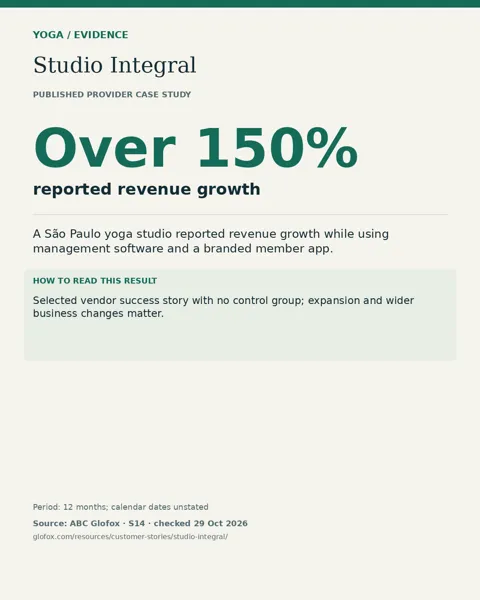
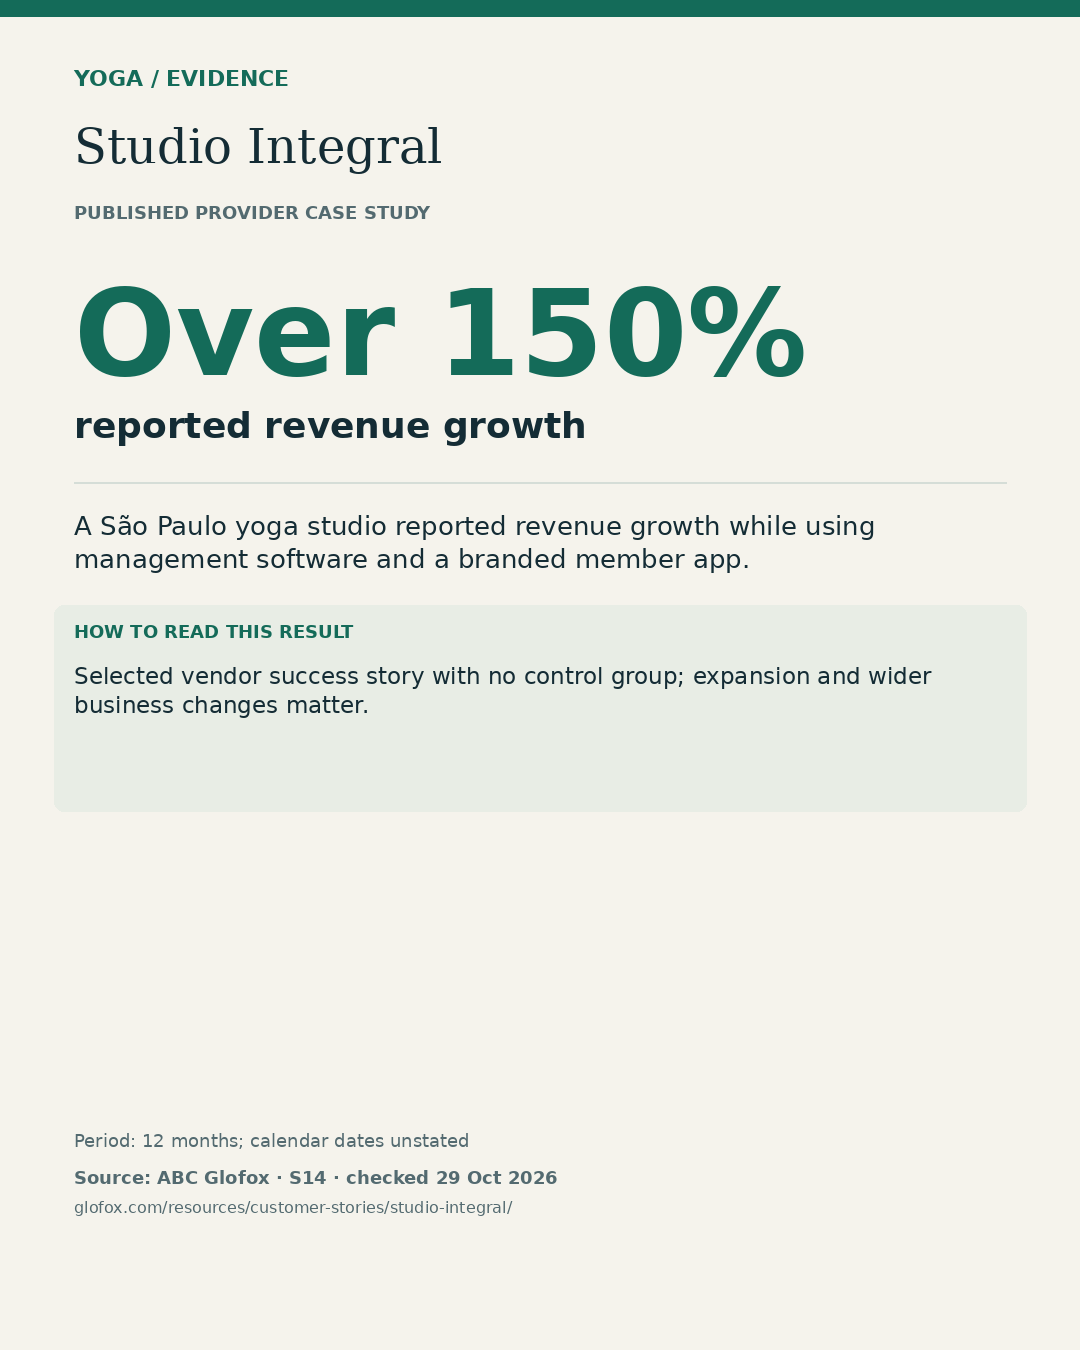
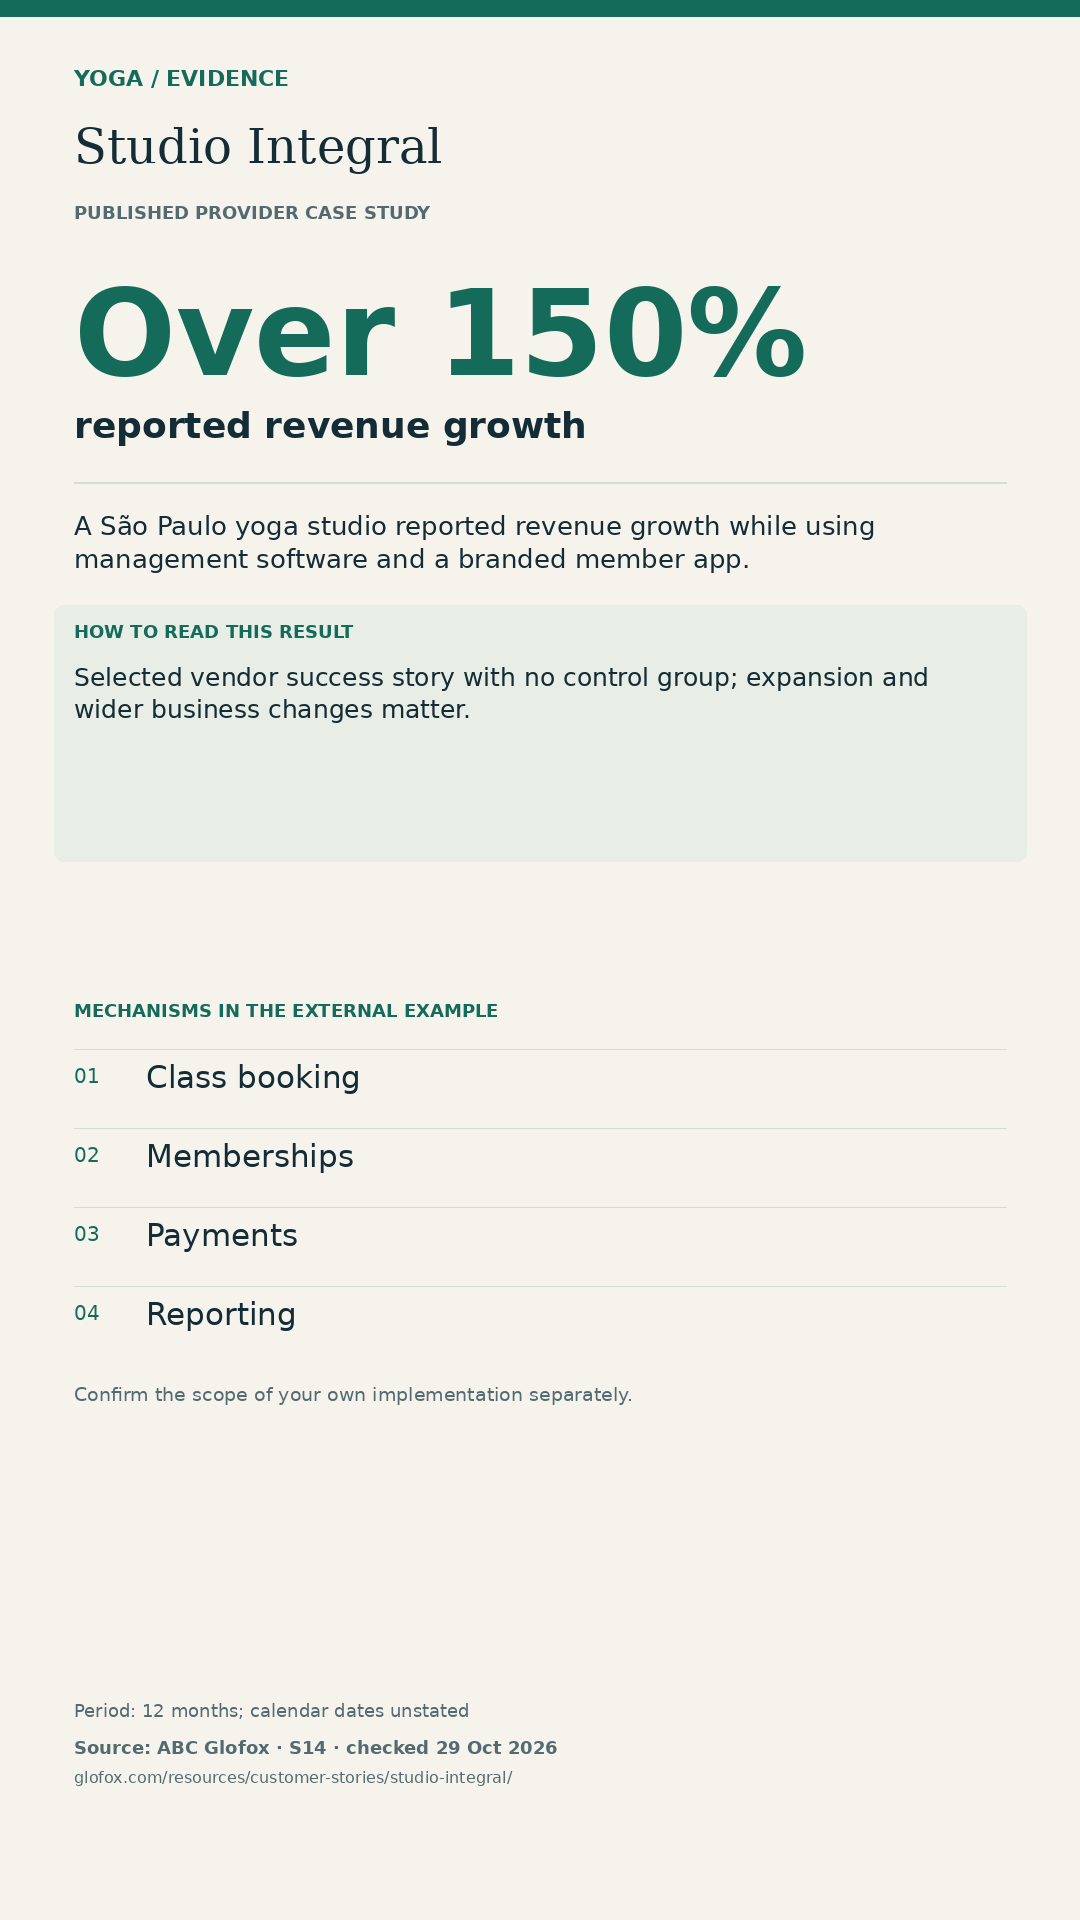
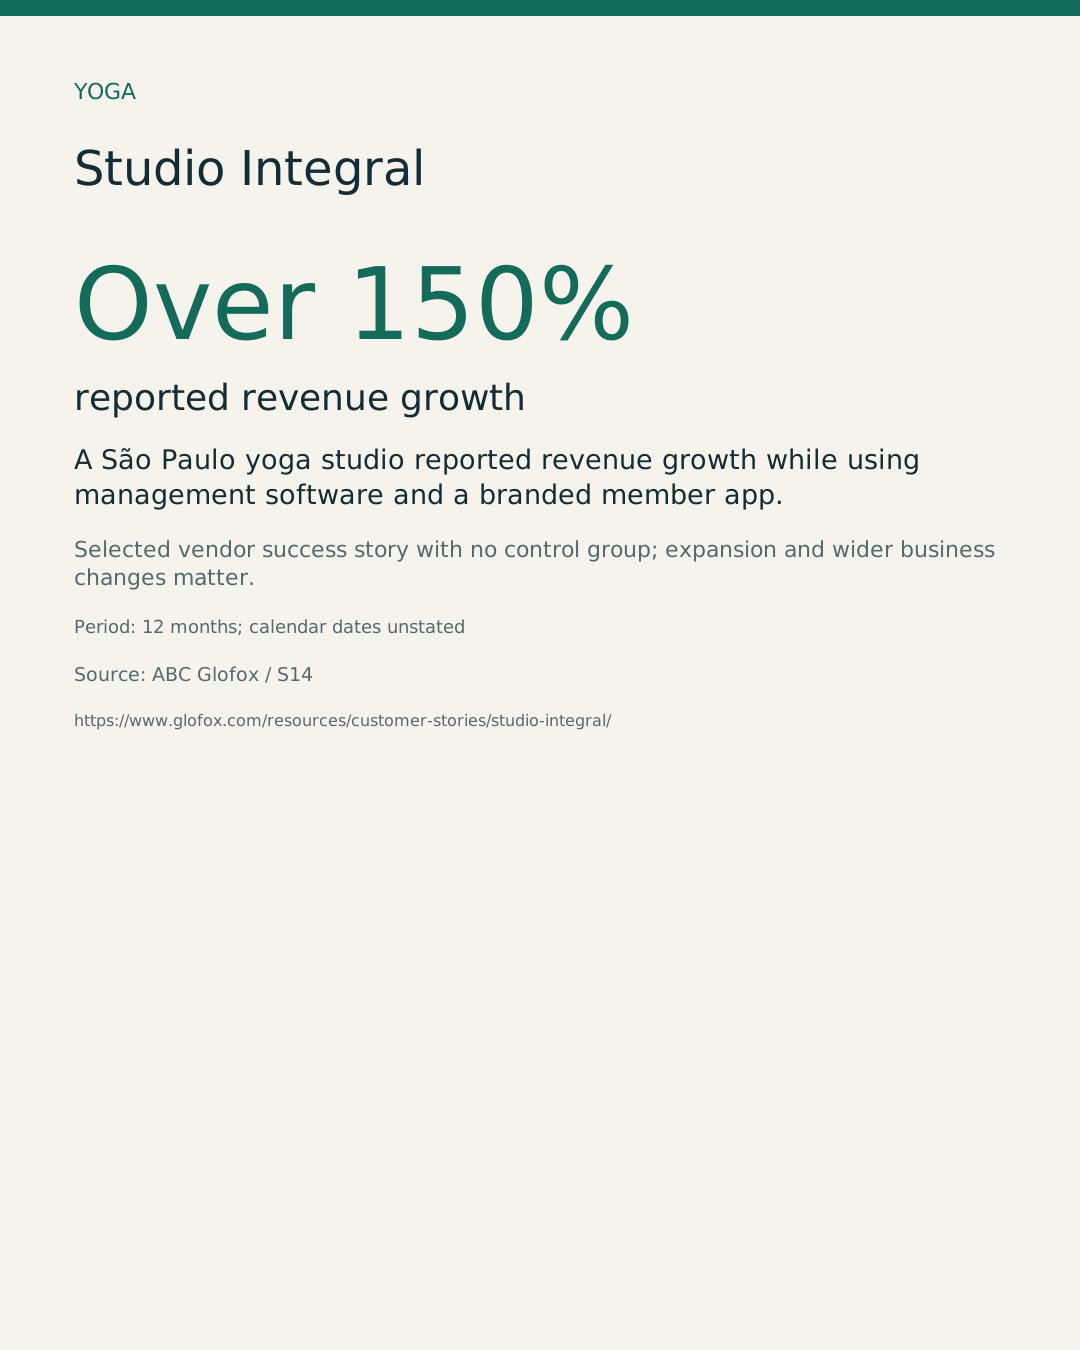
Over 150% reported revenue growth
Source: ABC Glofox. Selected vendor success story with no control group; expansion and wider business changes matter.
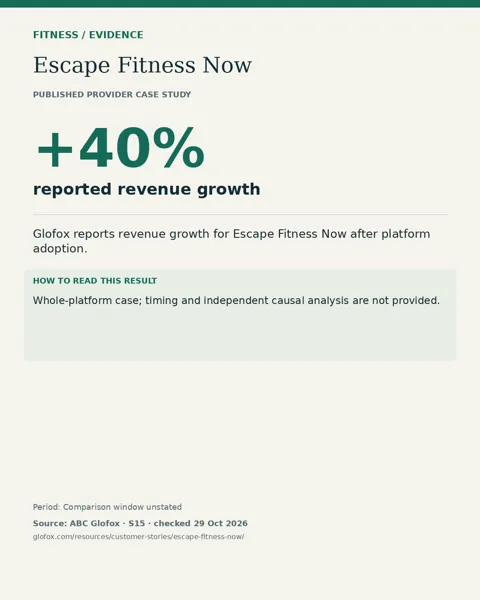
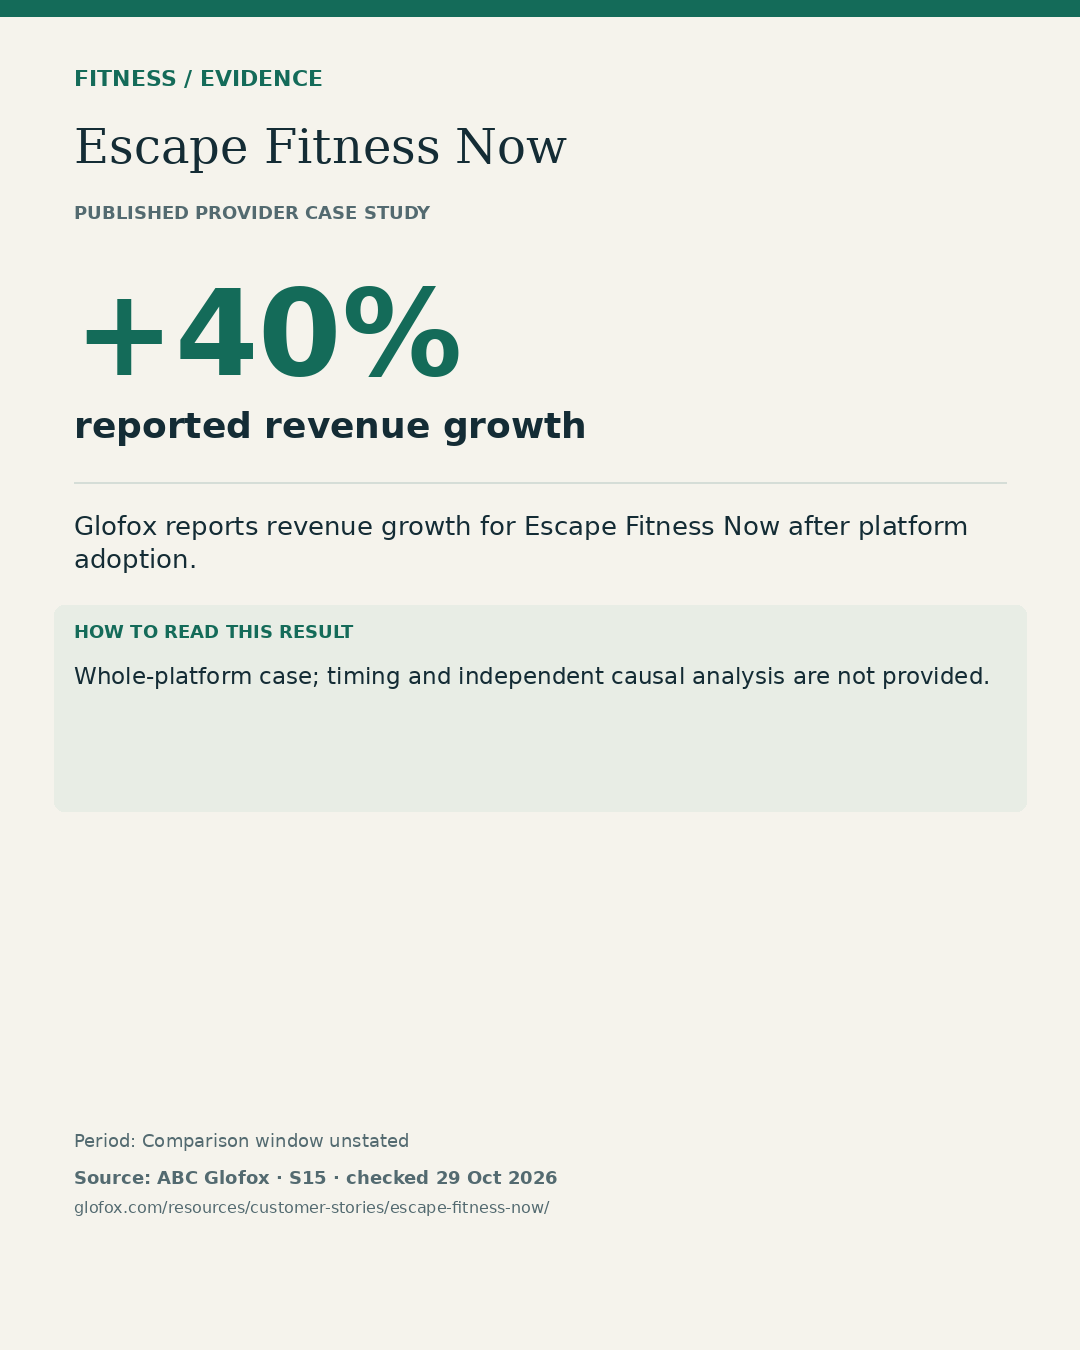
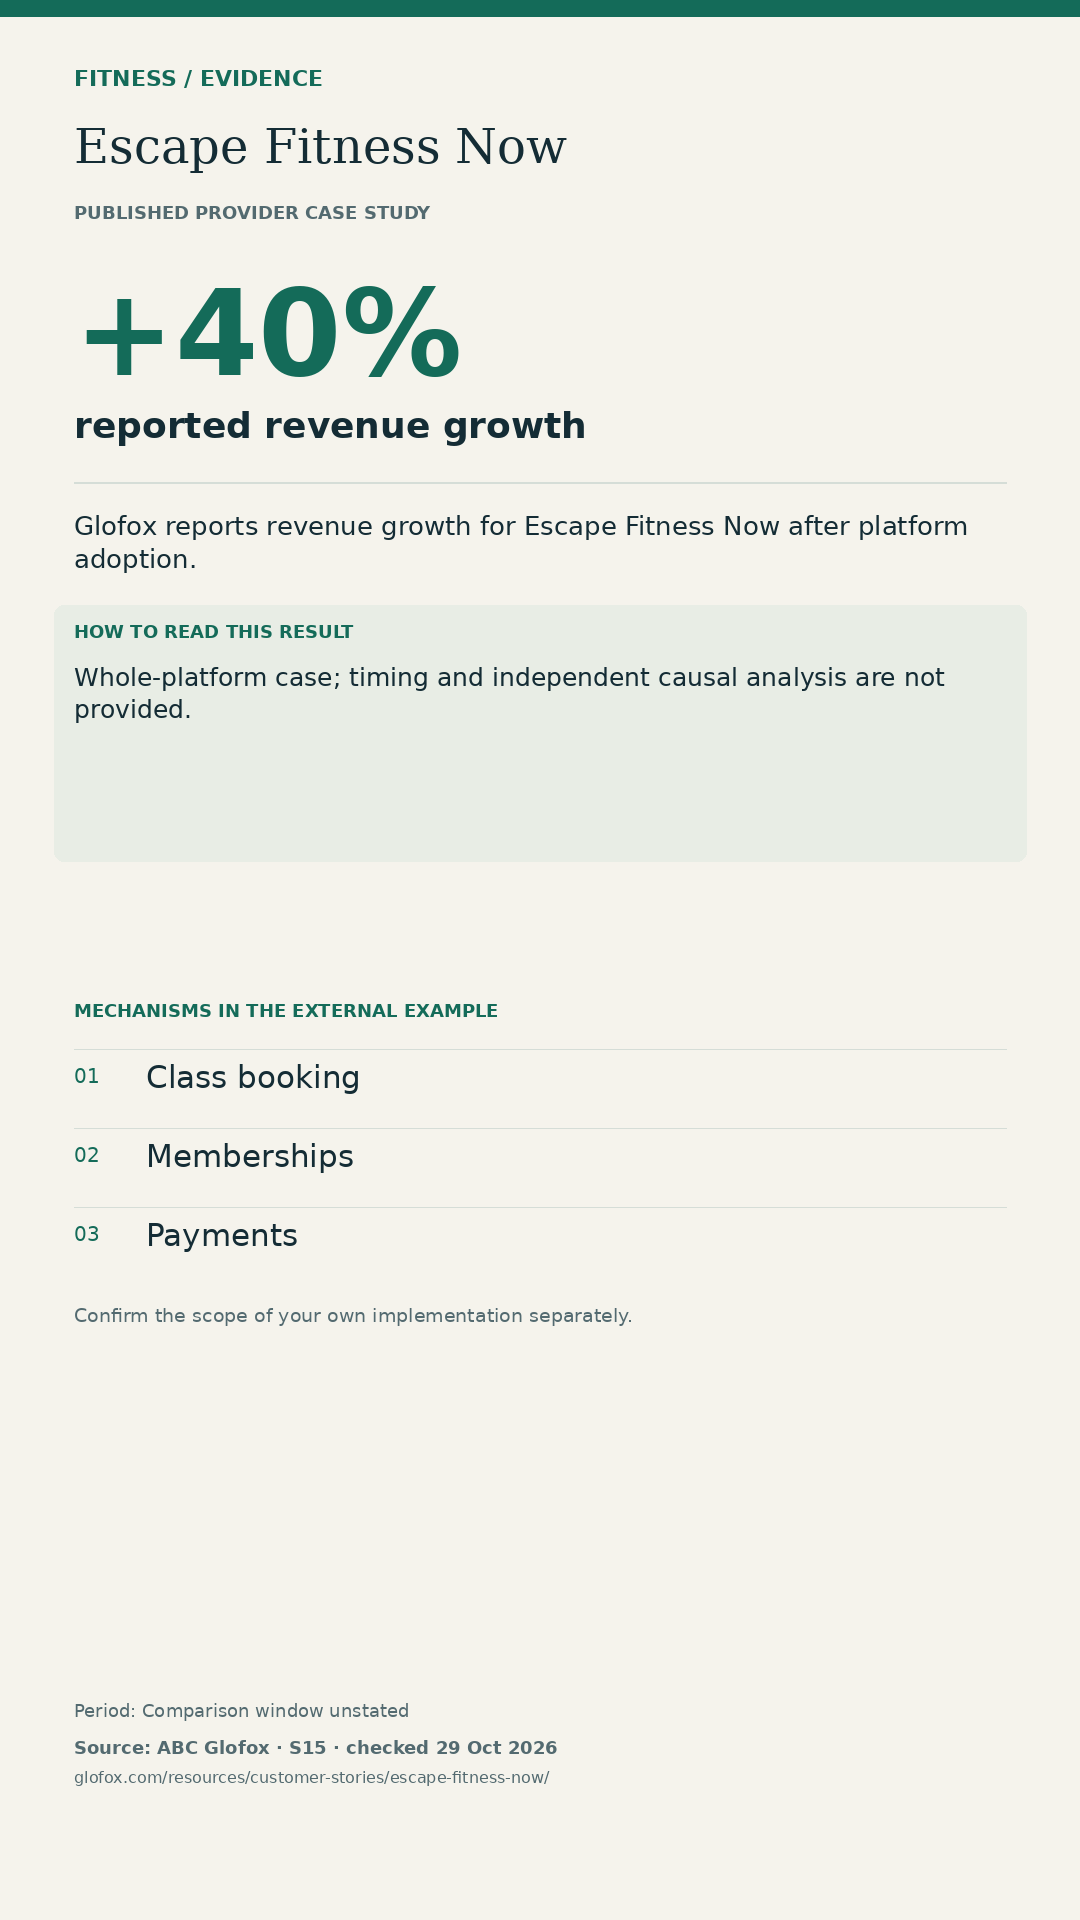
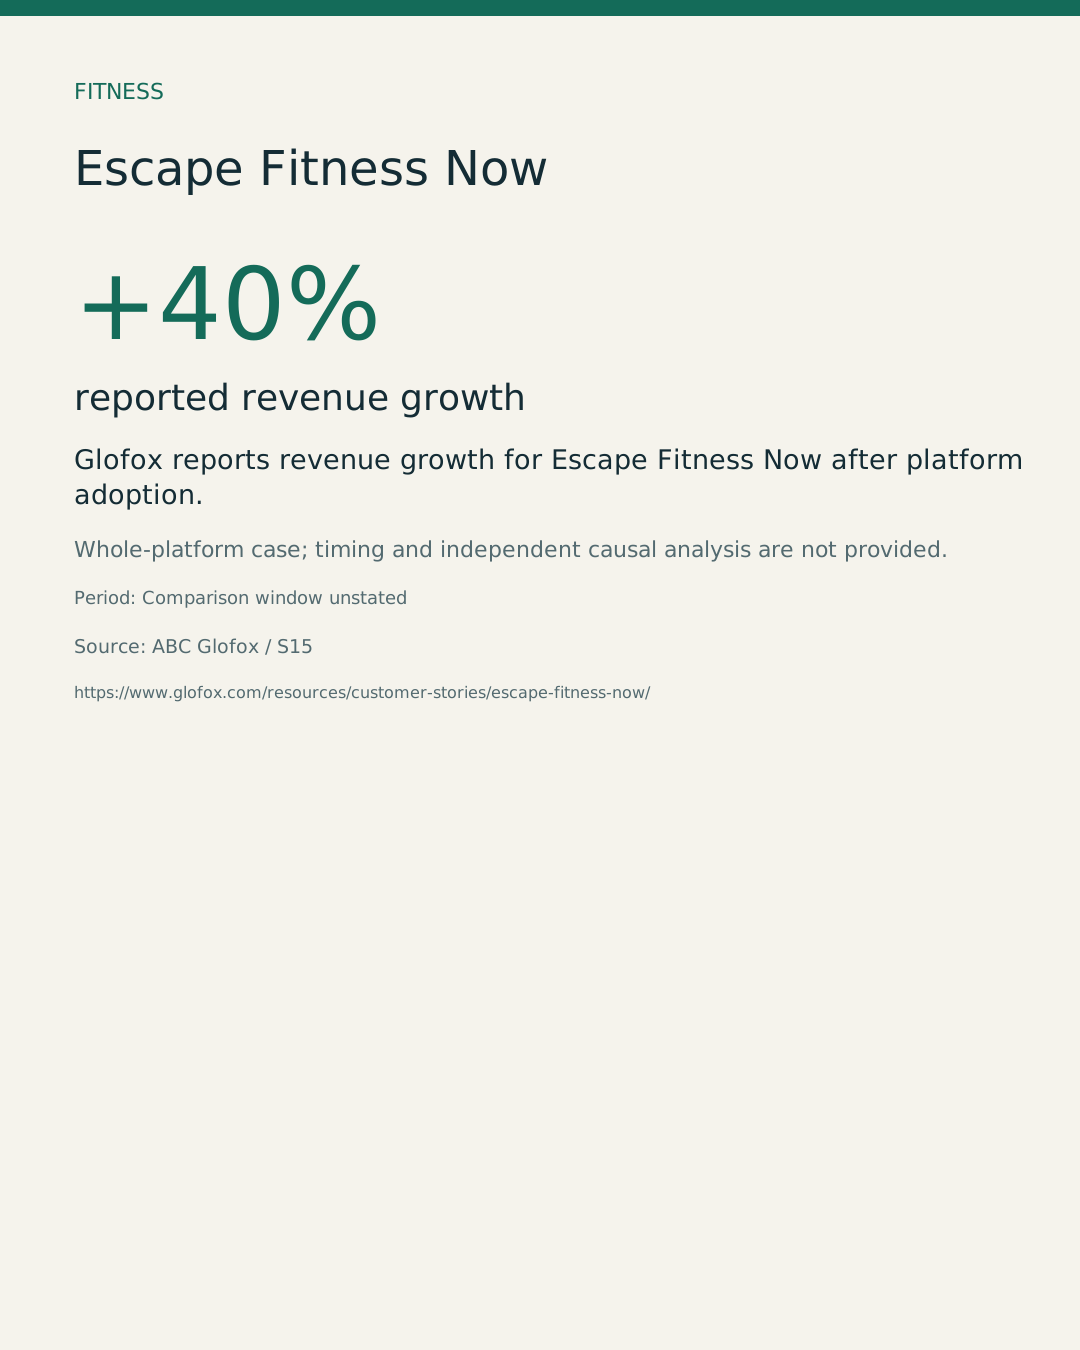
+40% reported revenue growth
Source: ABC Glofox. Whole-platform case; timing and independent causal analysis are not provided.
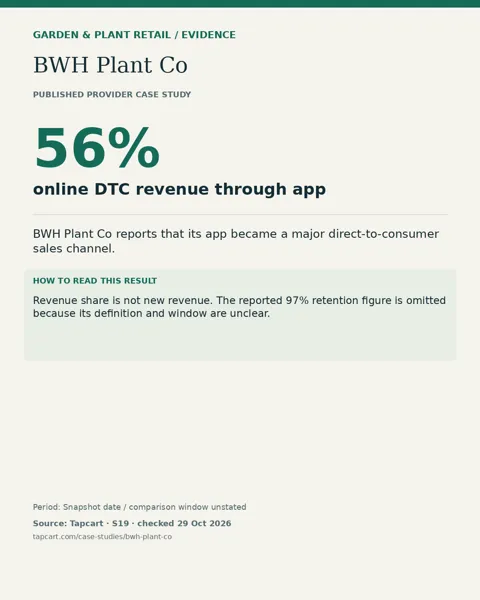
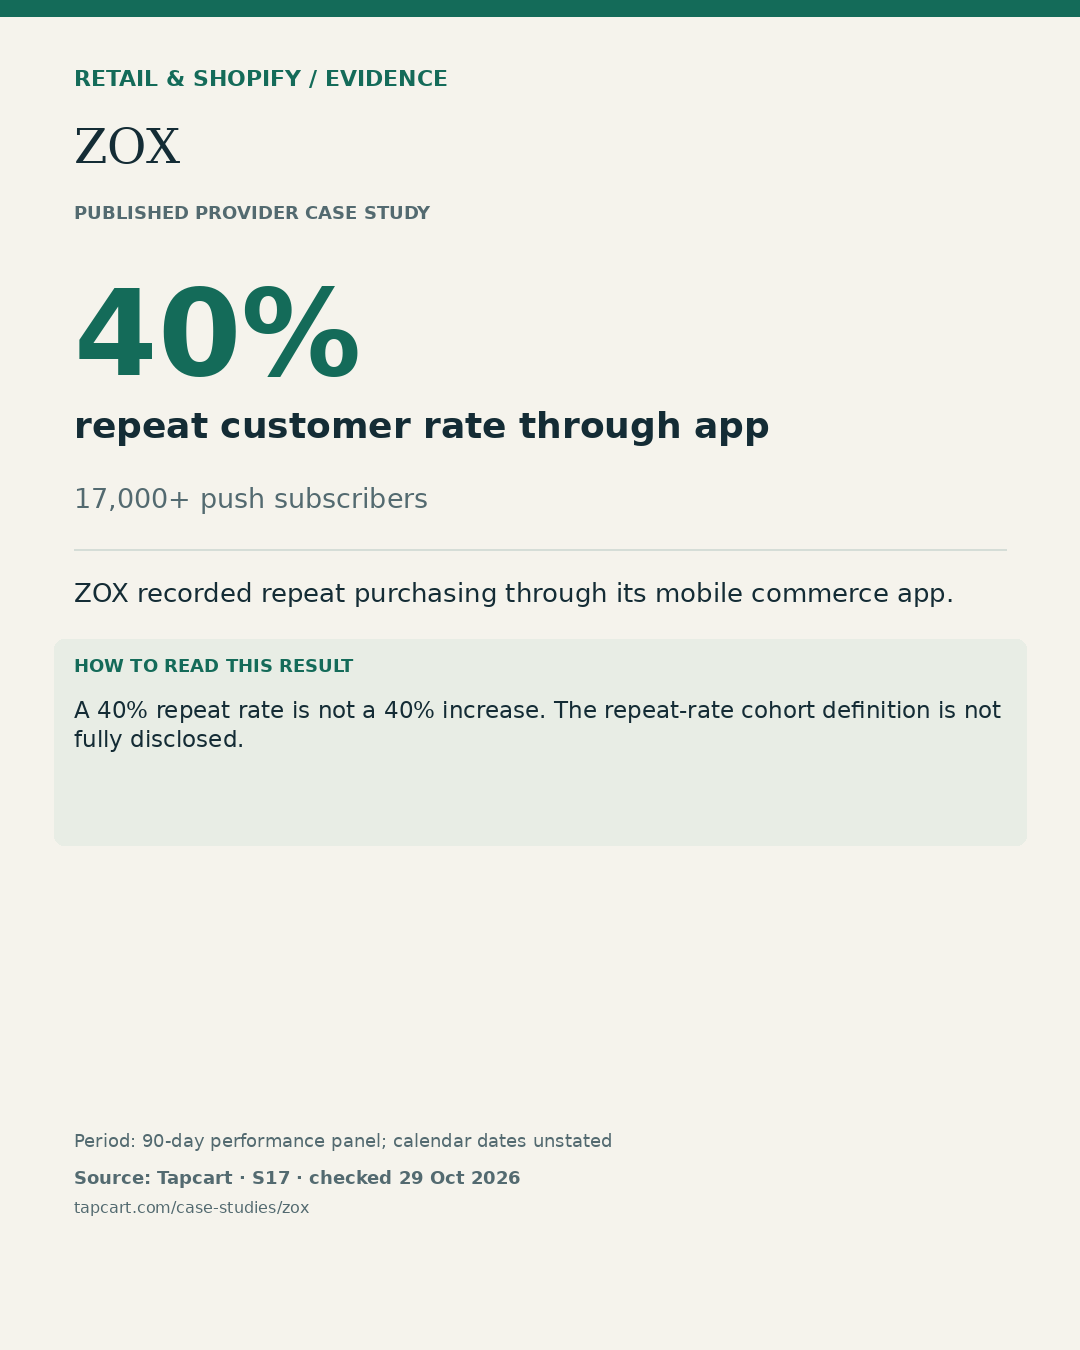
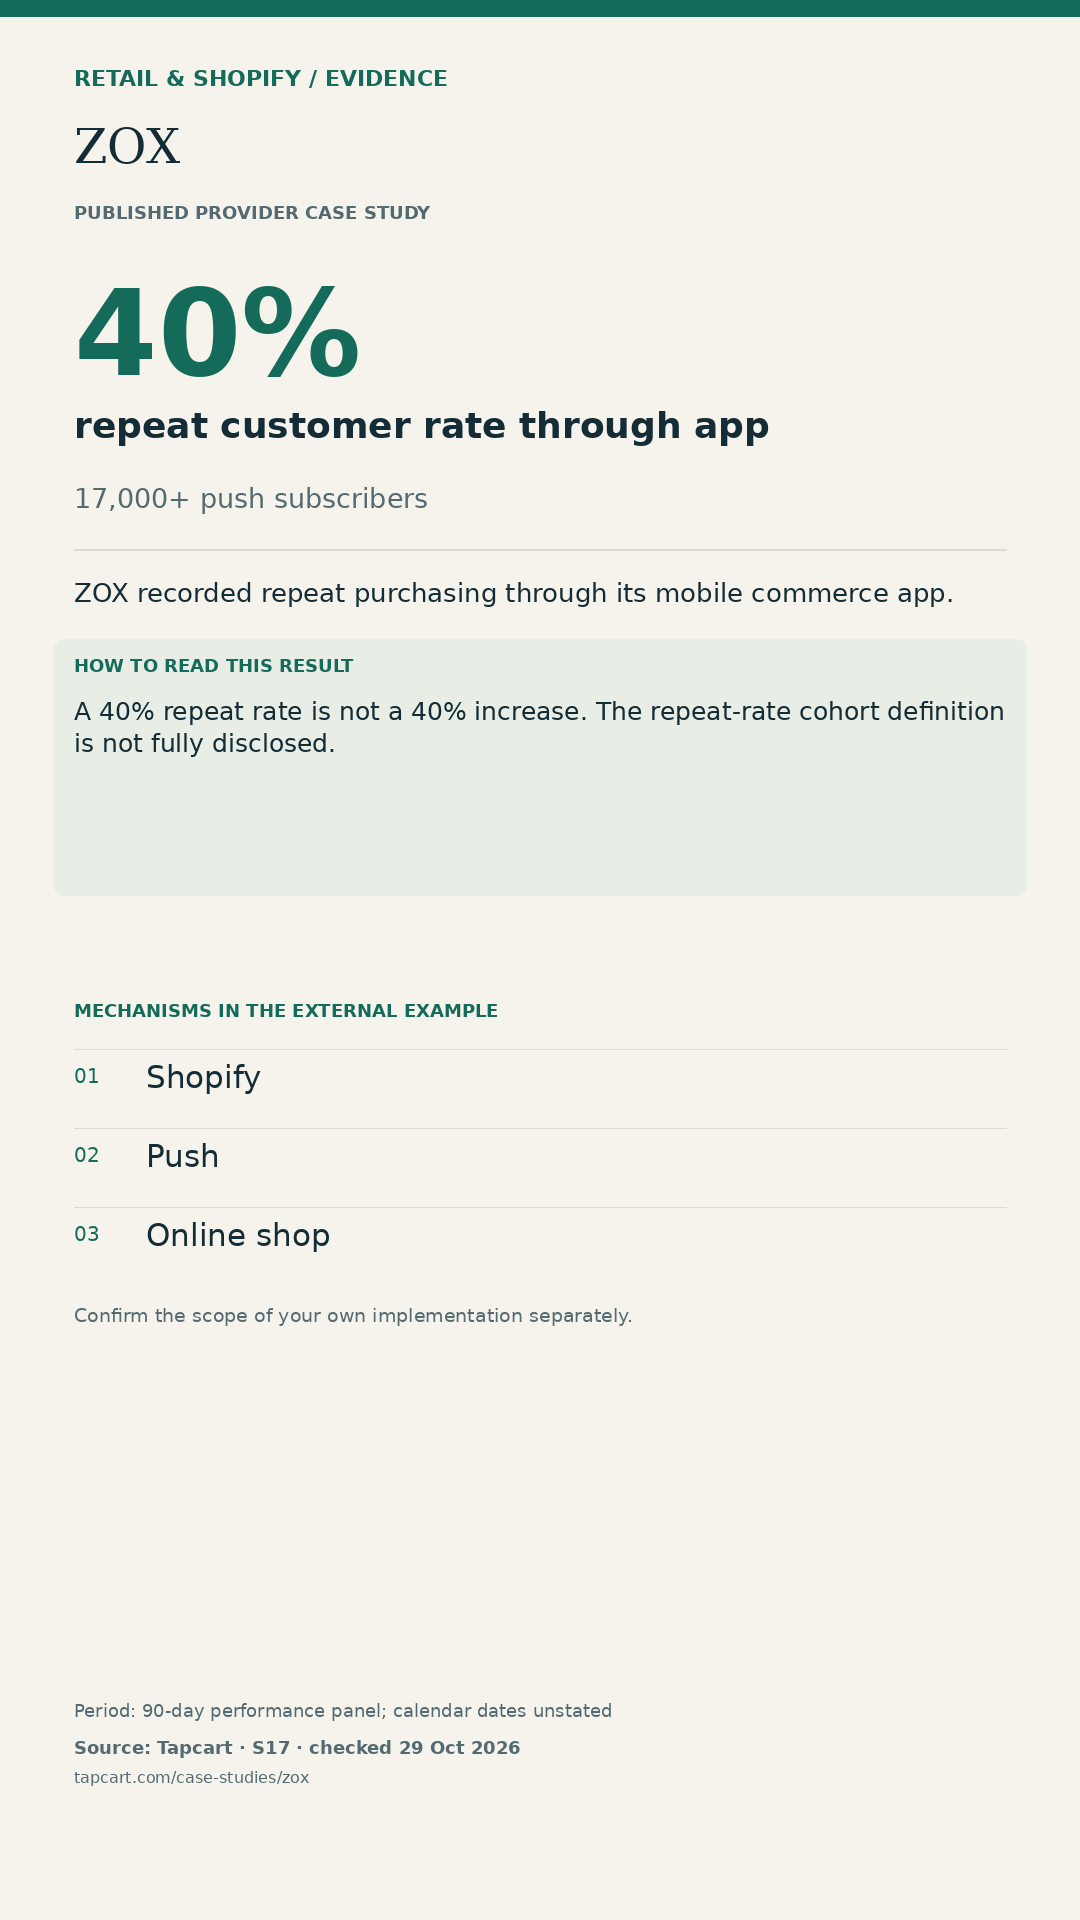
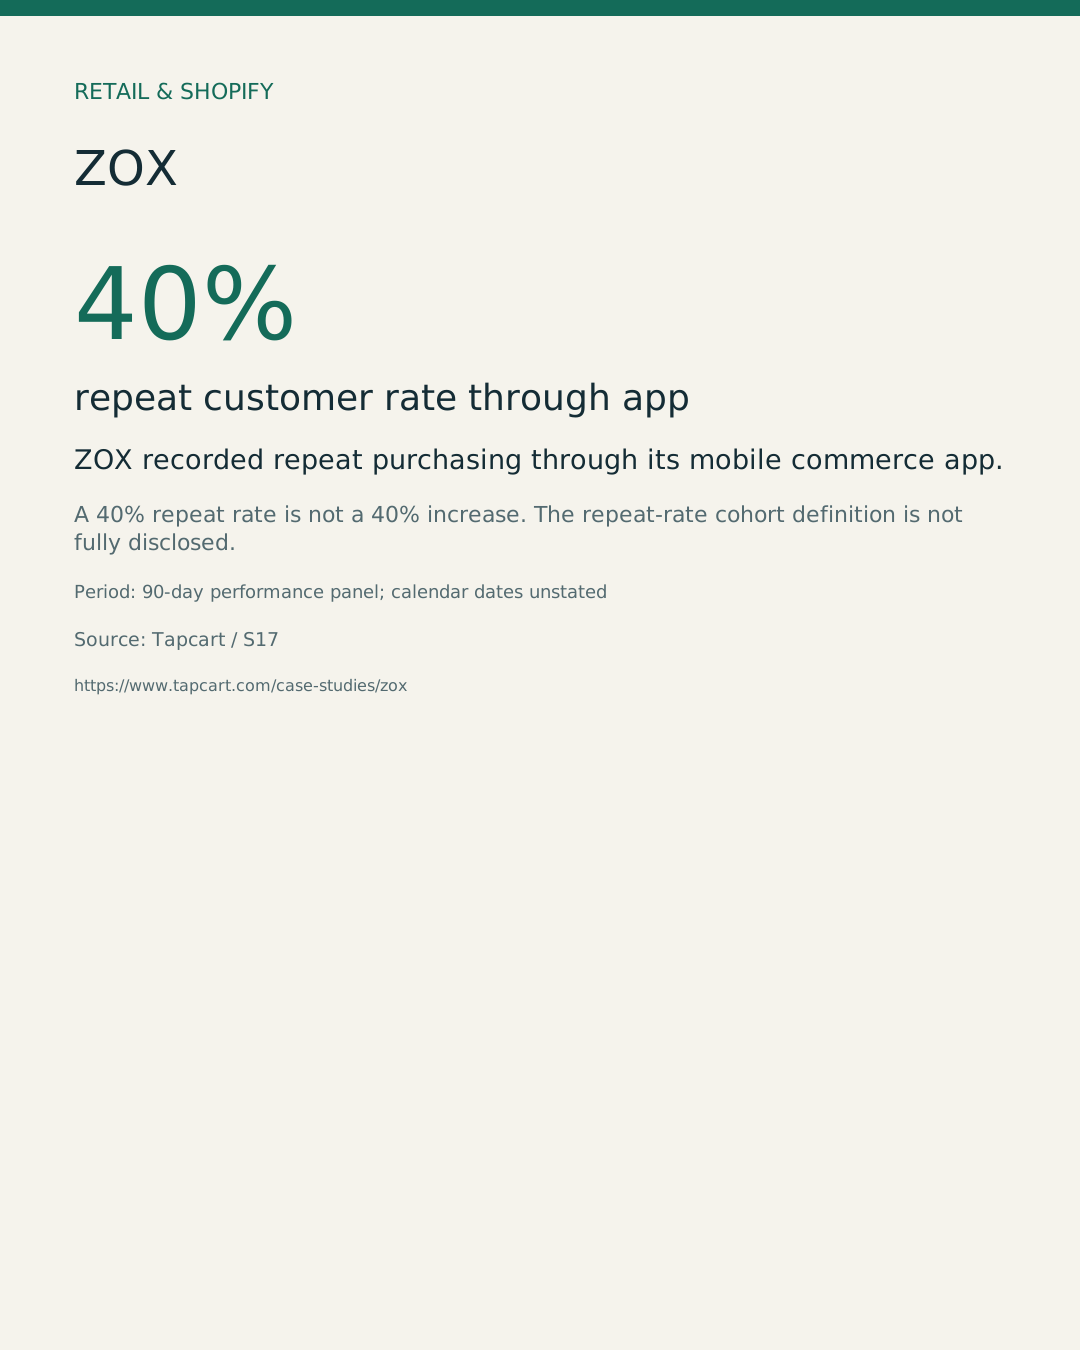
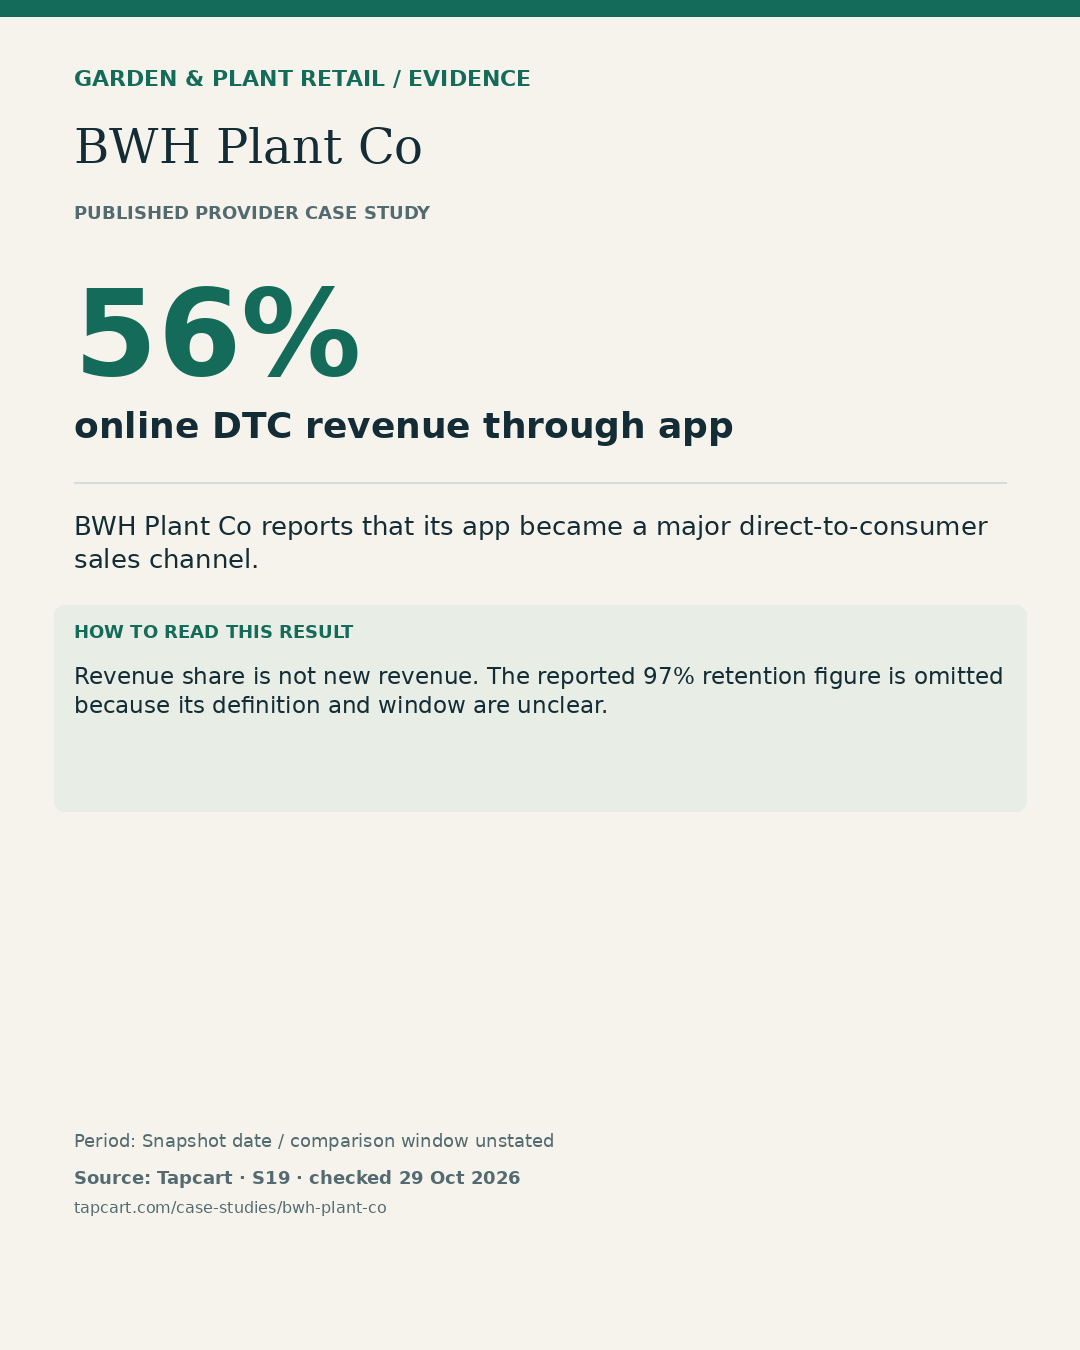
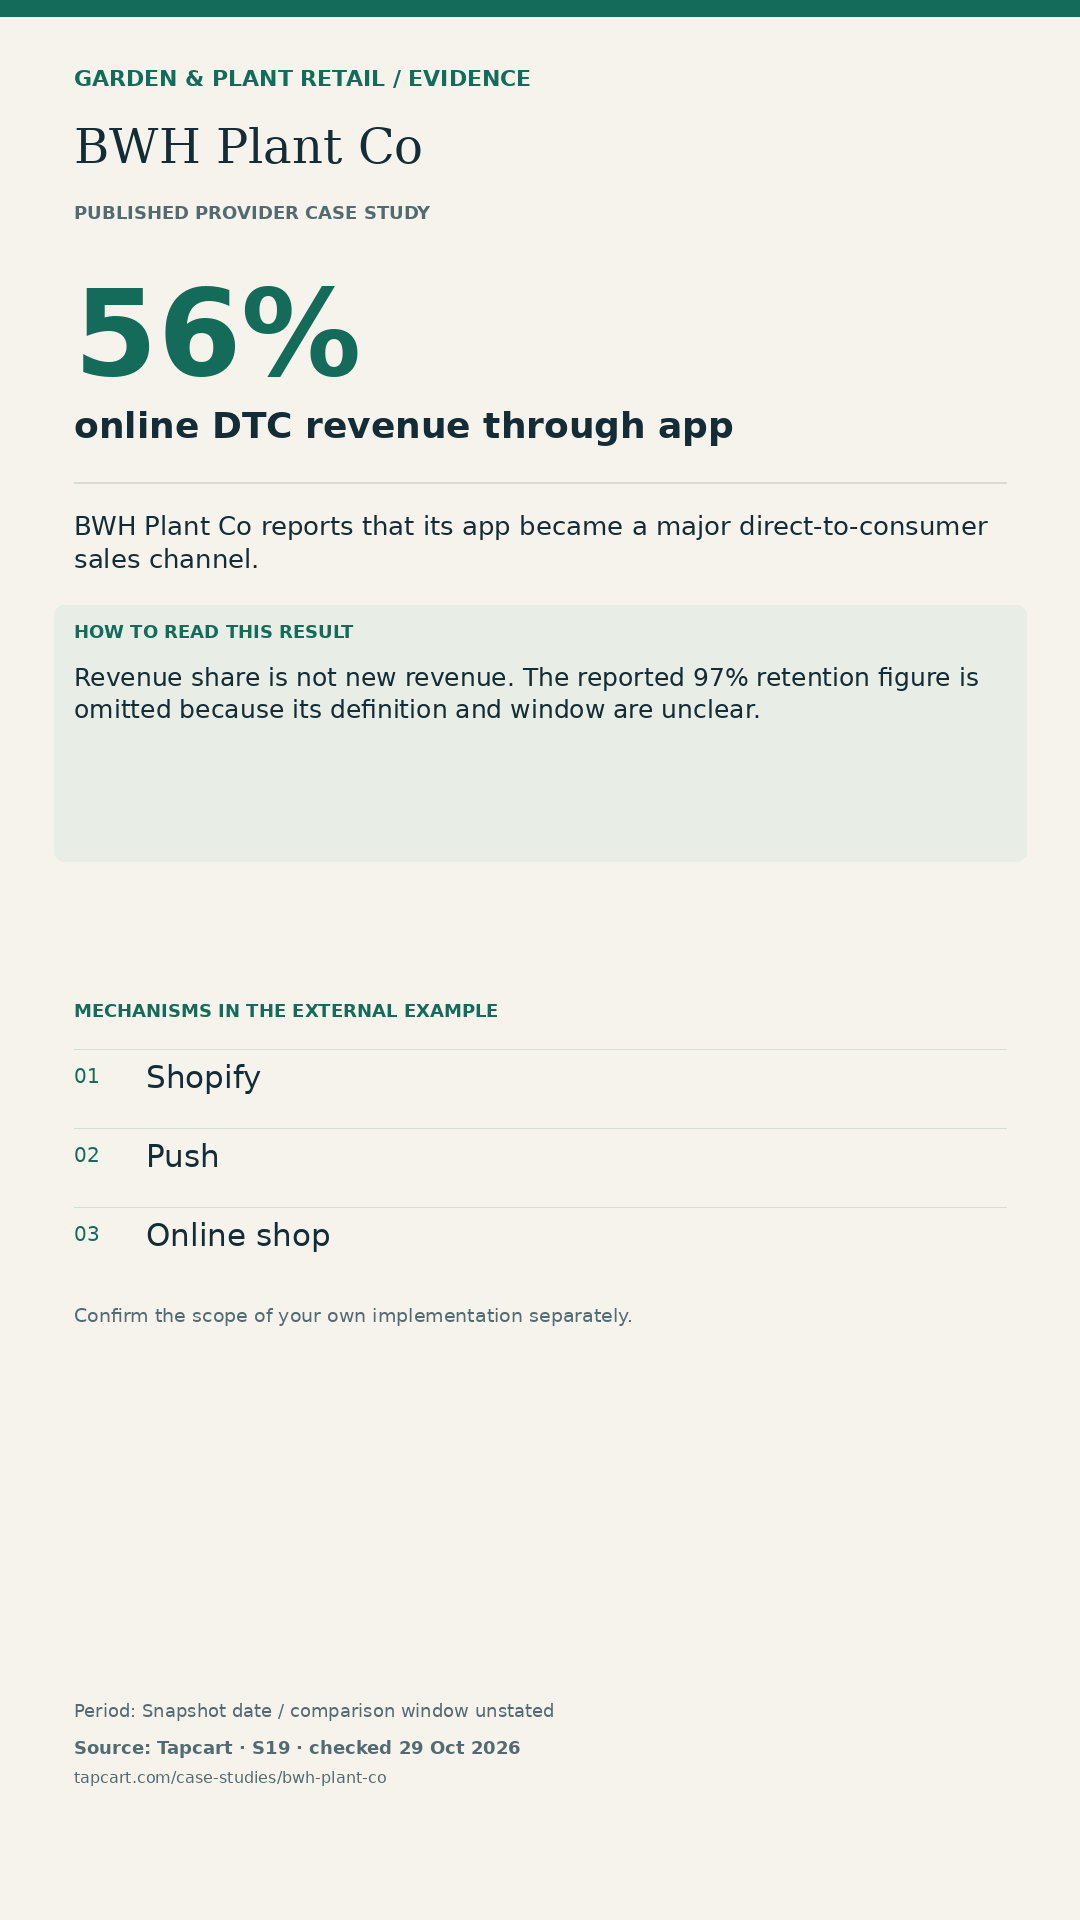
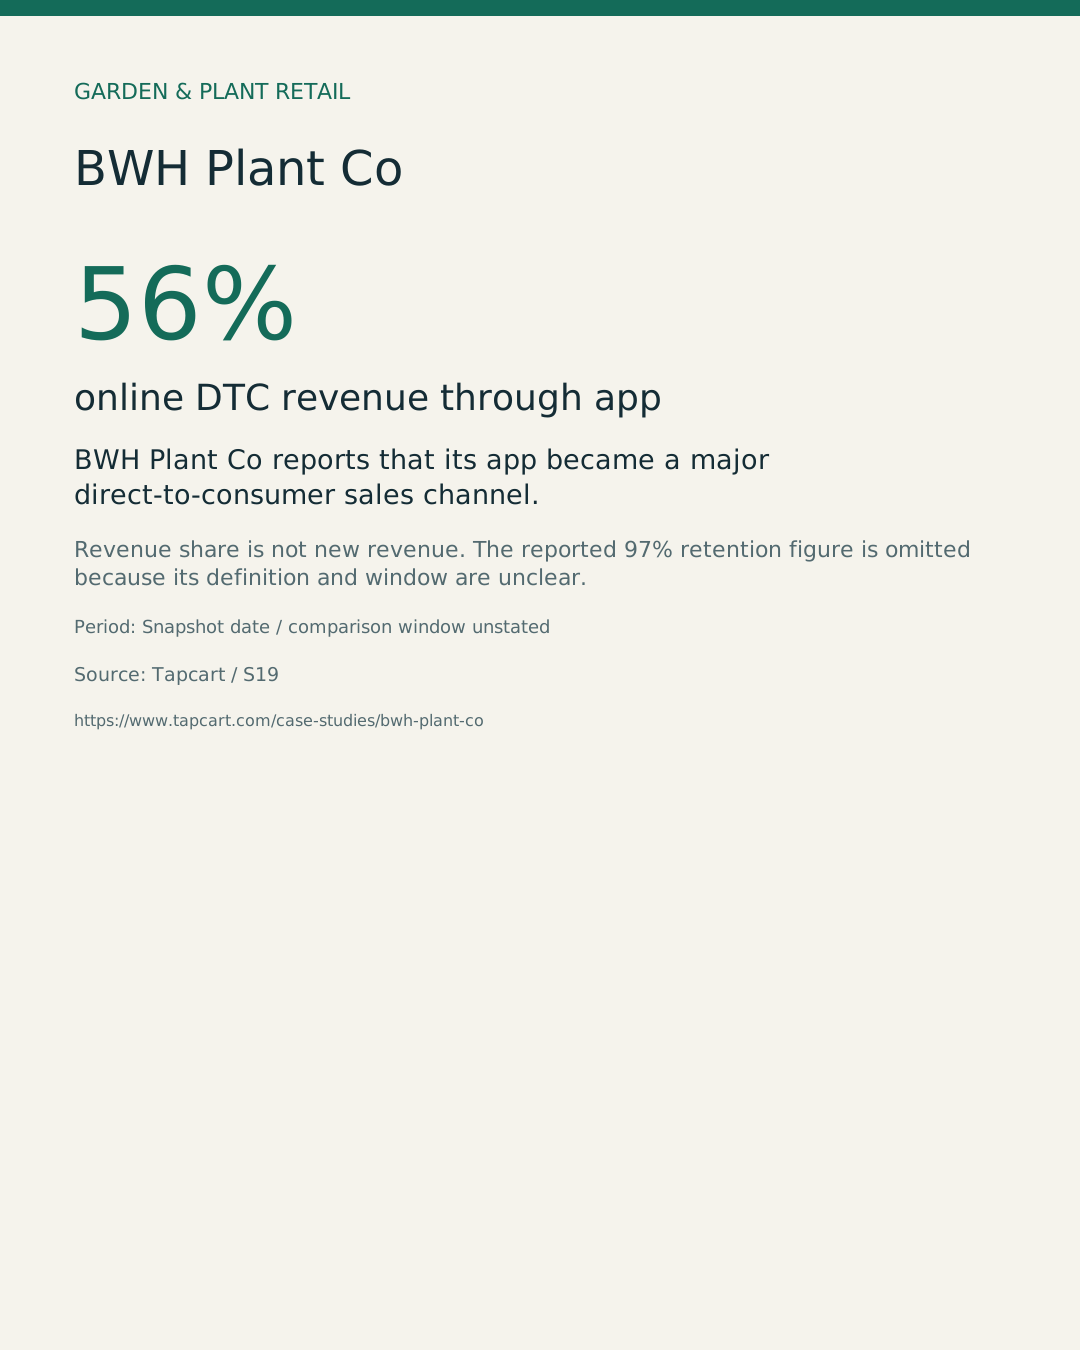
56% online DTC revenue through app
Source: Tapcart. Revenue share is not new revenue. The reported 97% retention figure is omitted because its definition and window are unclear.
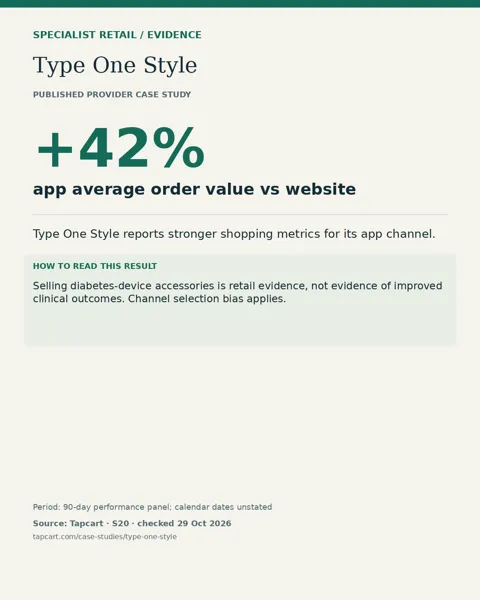
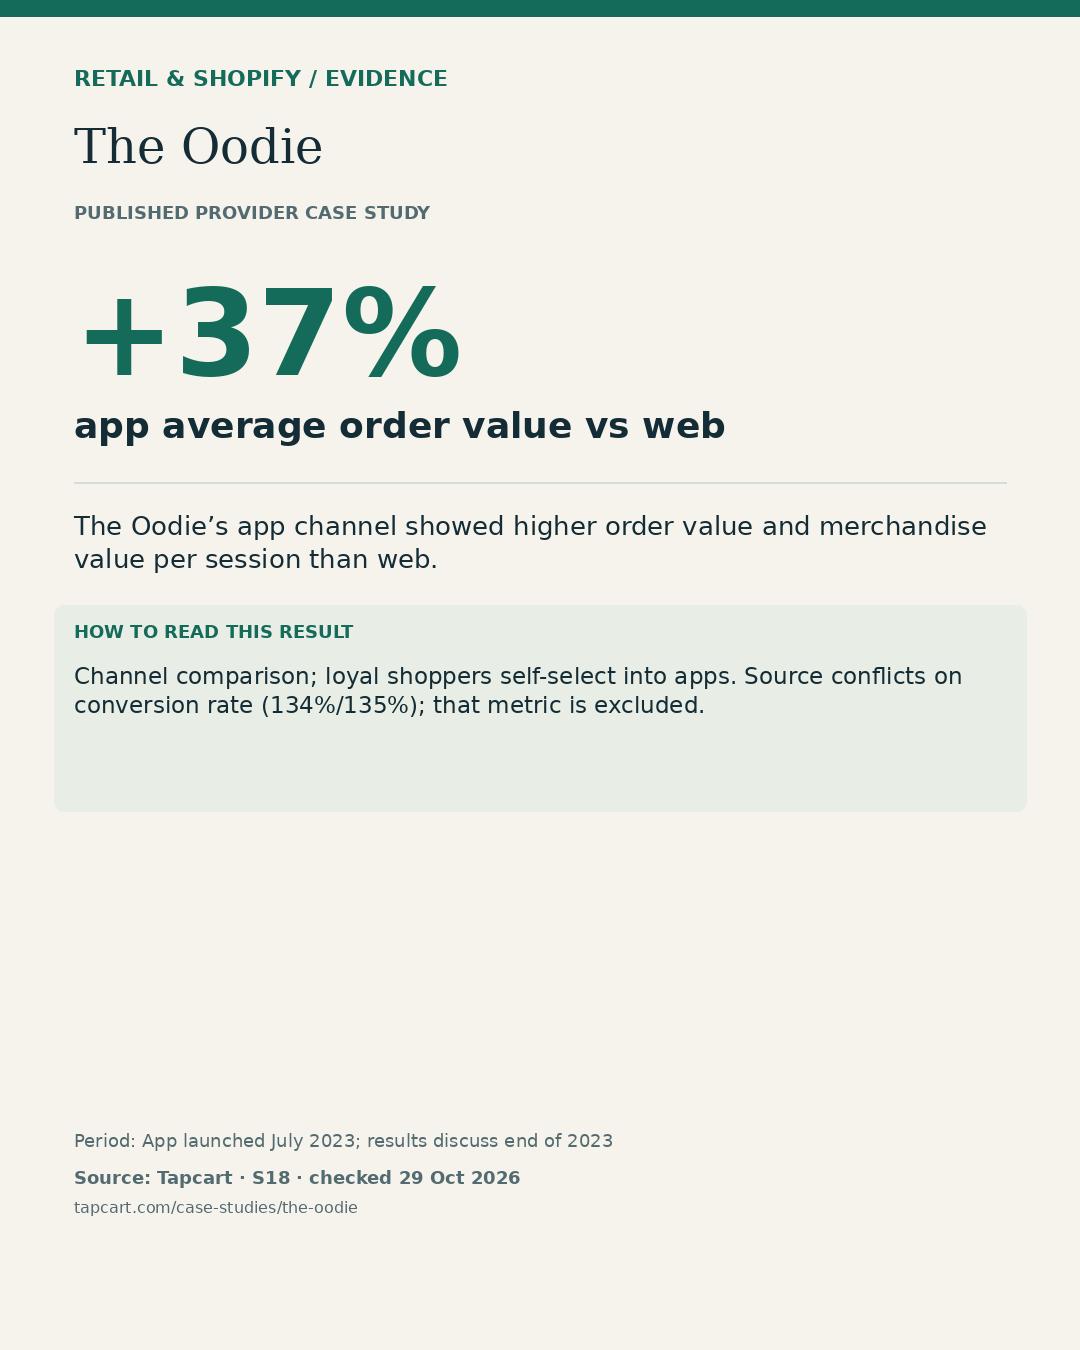
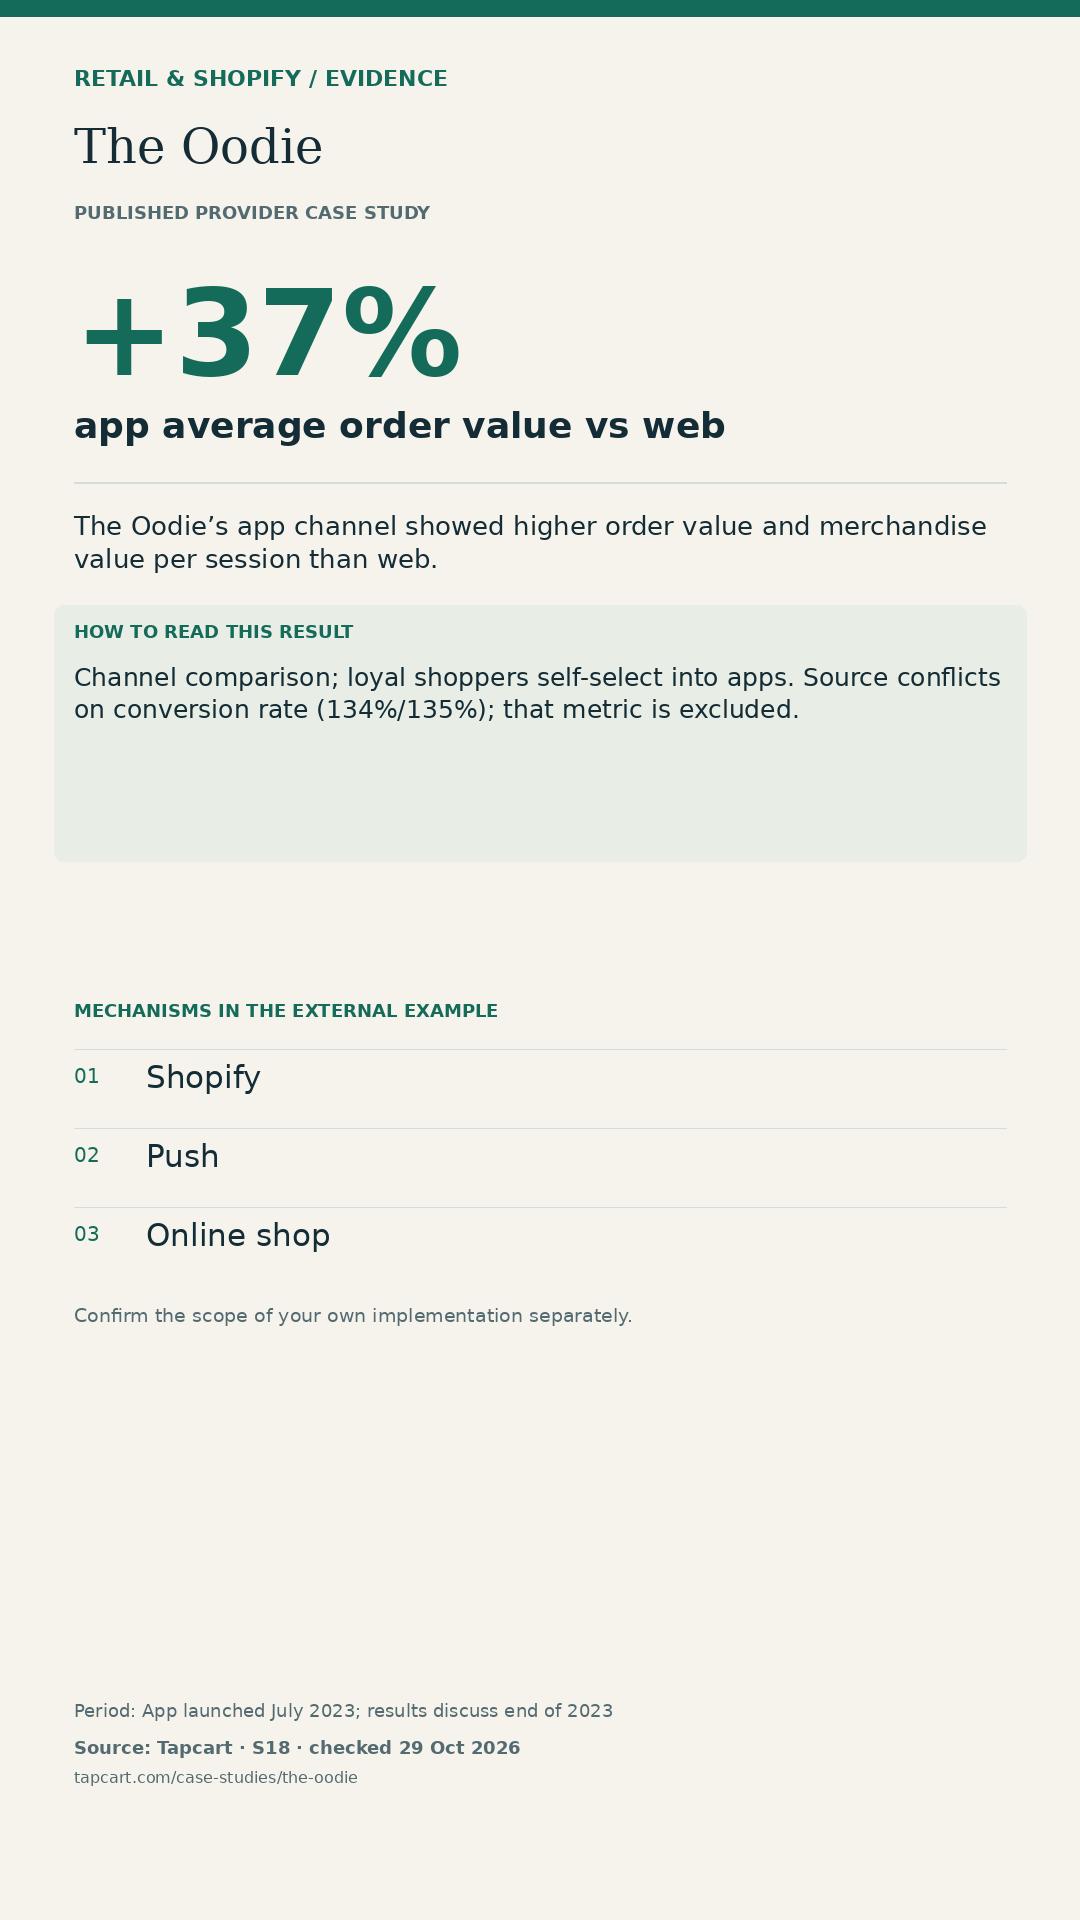
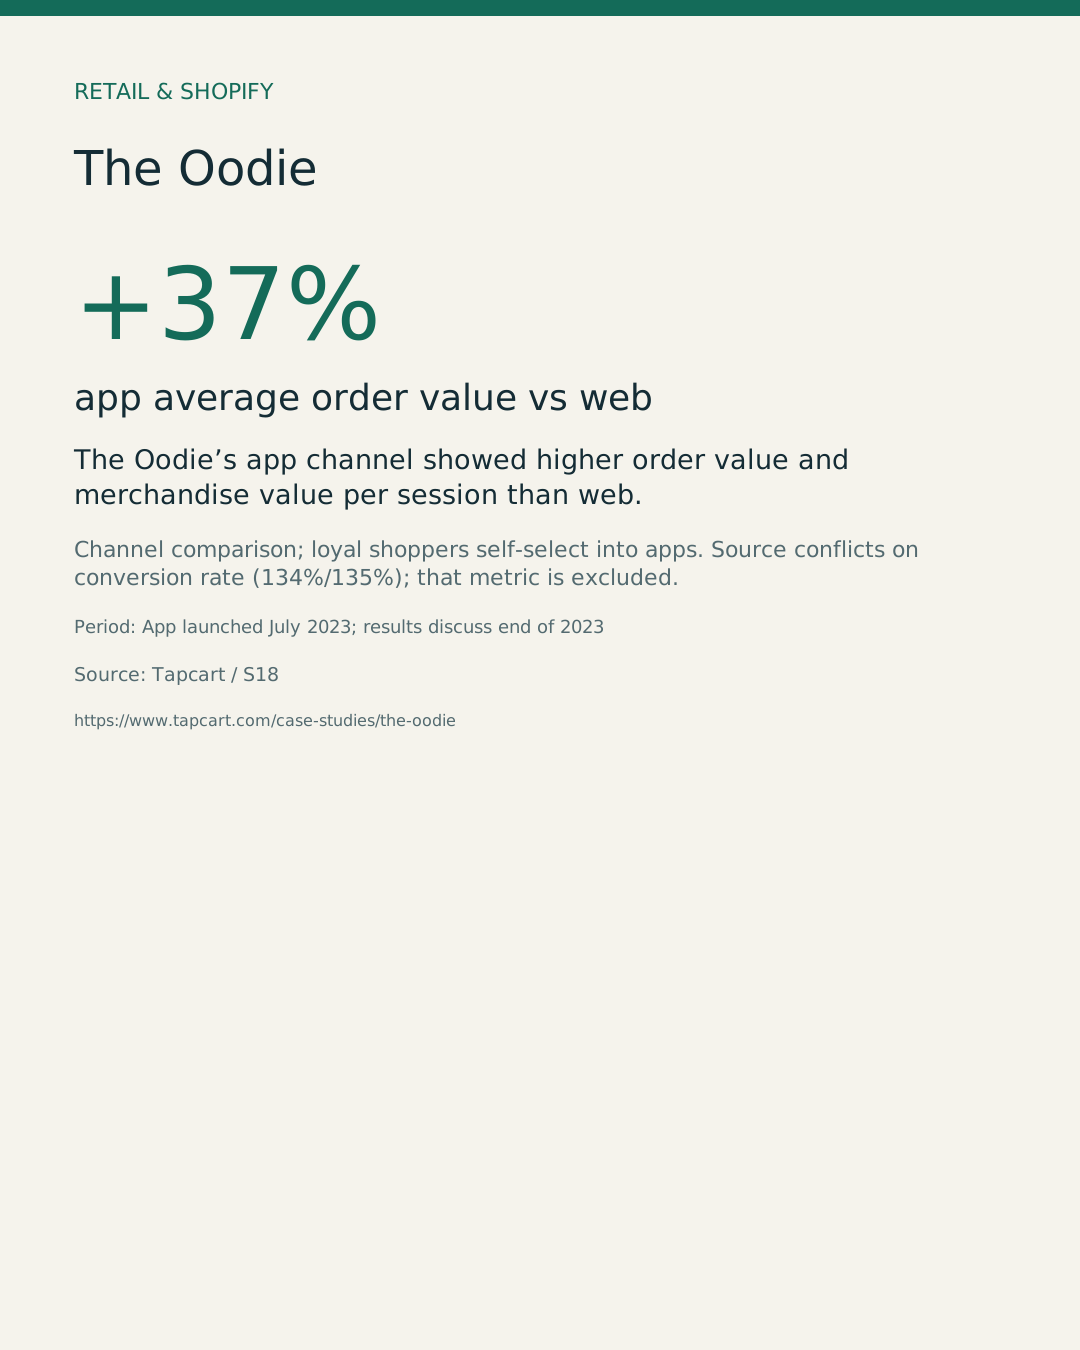
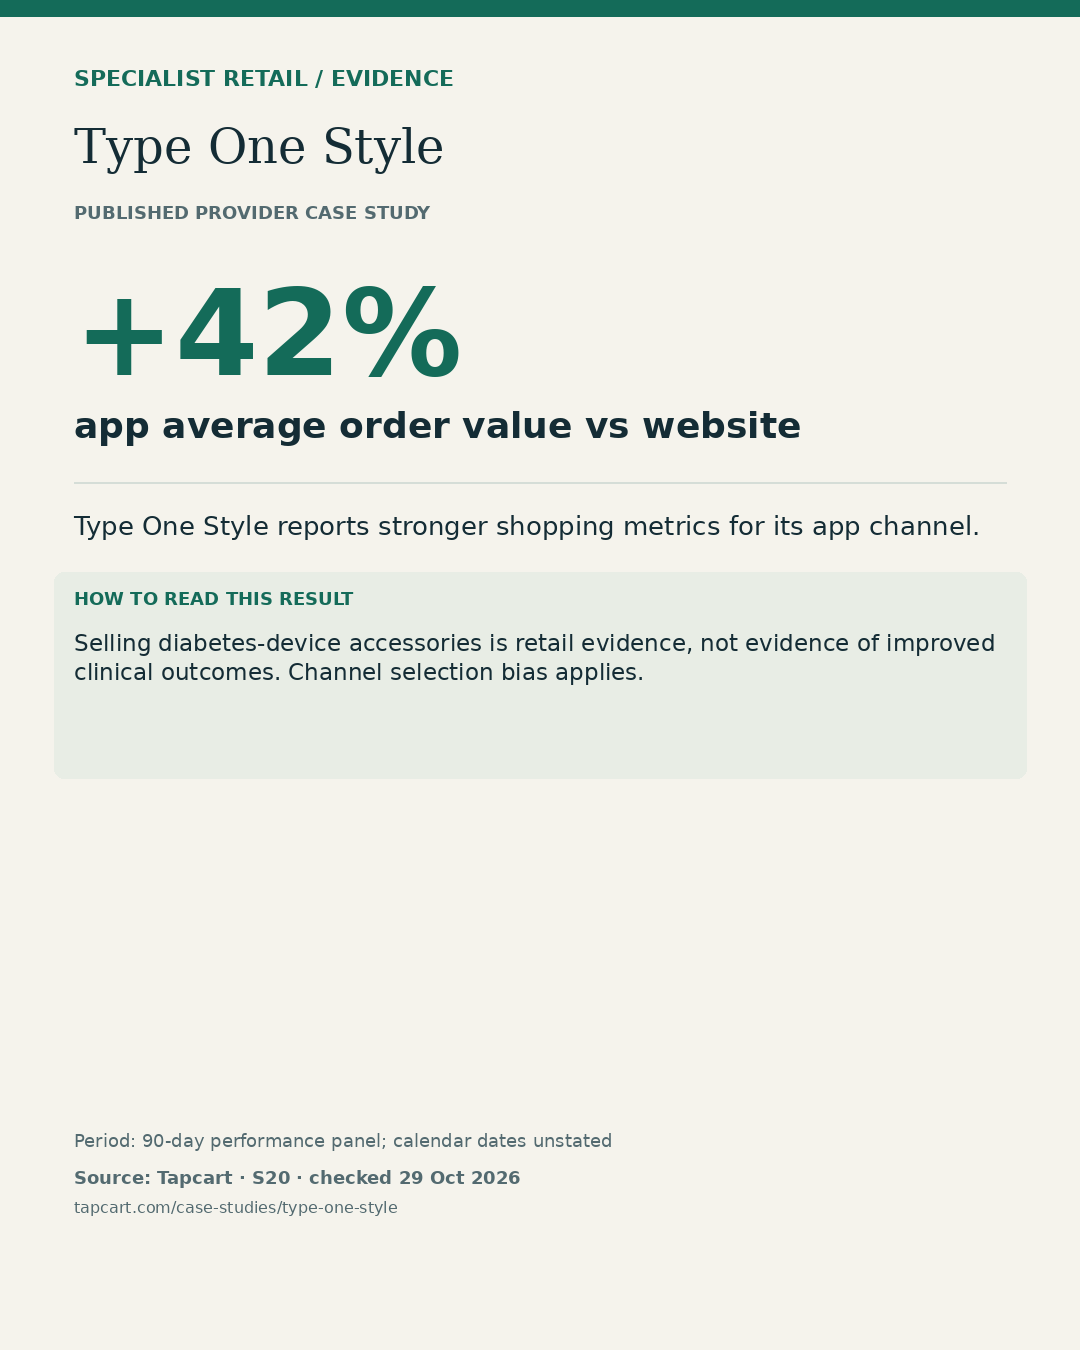
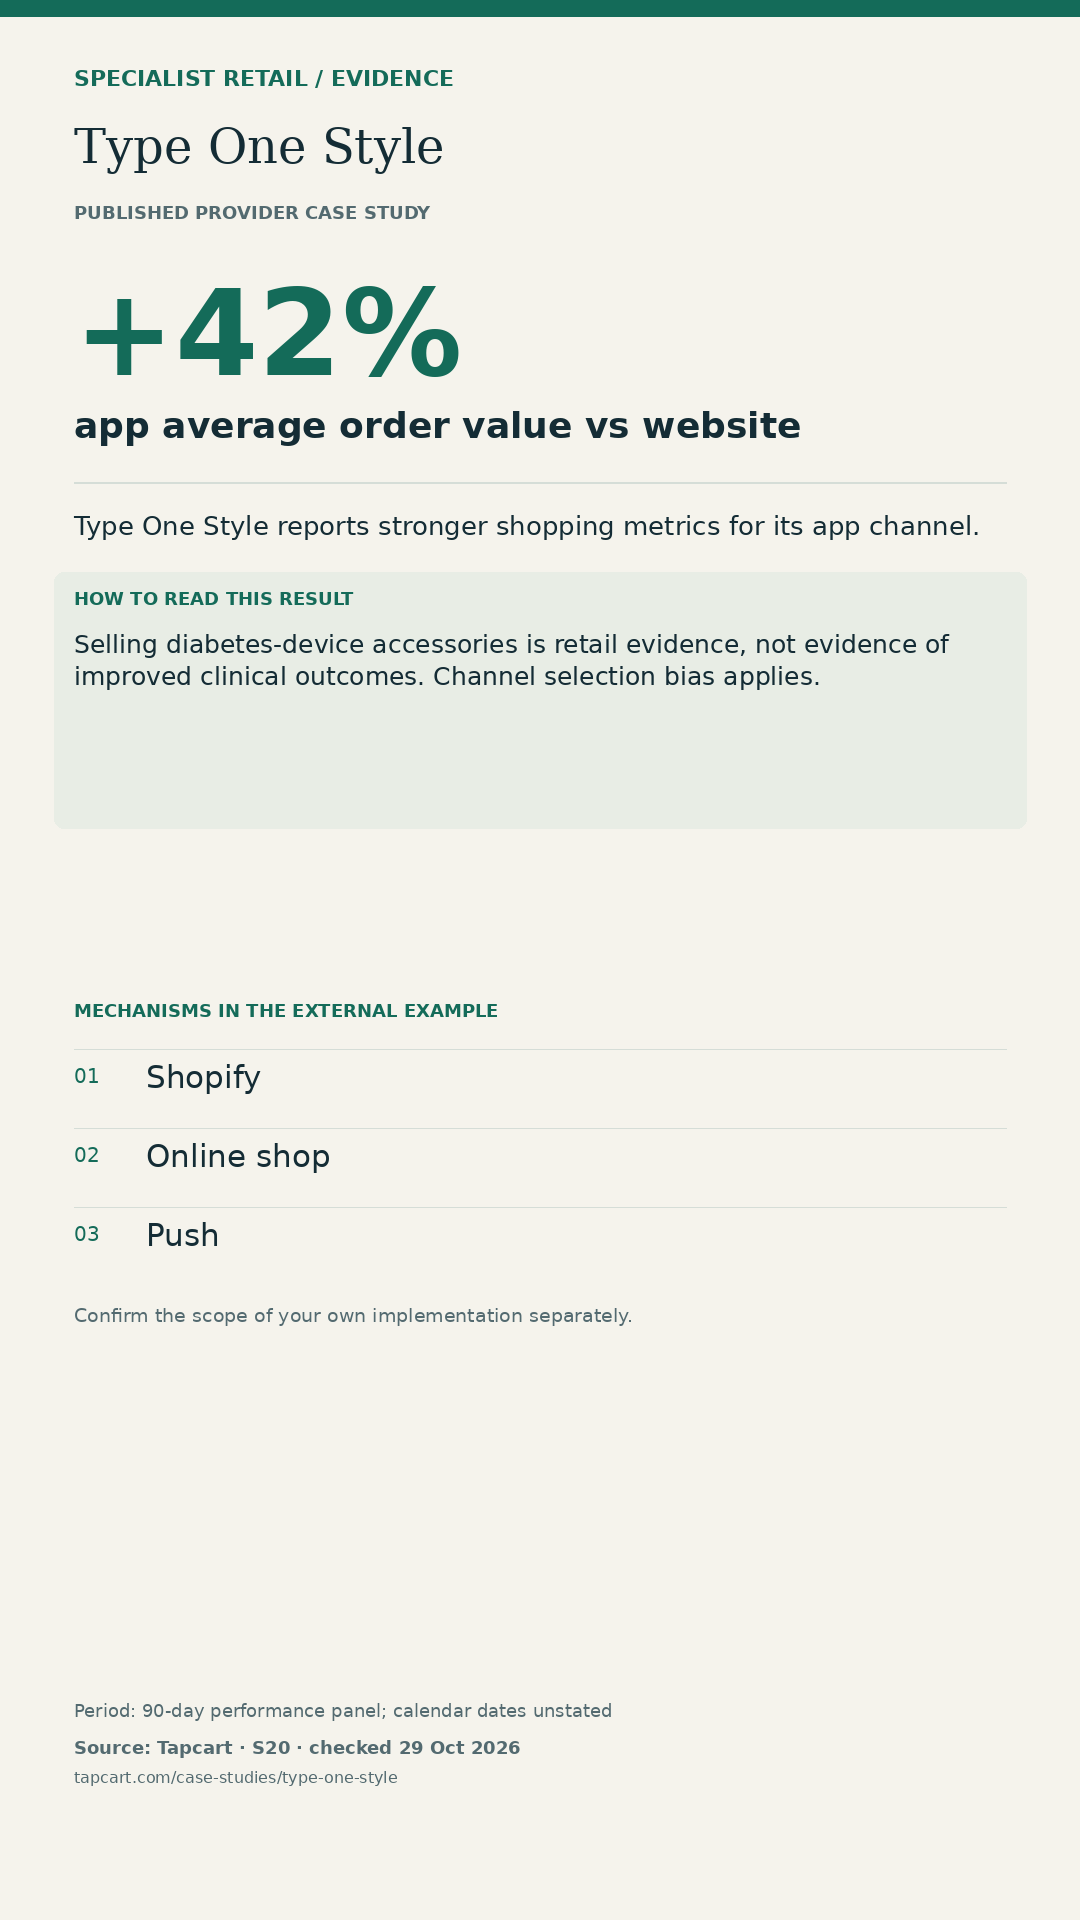
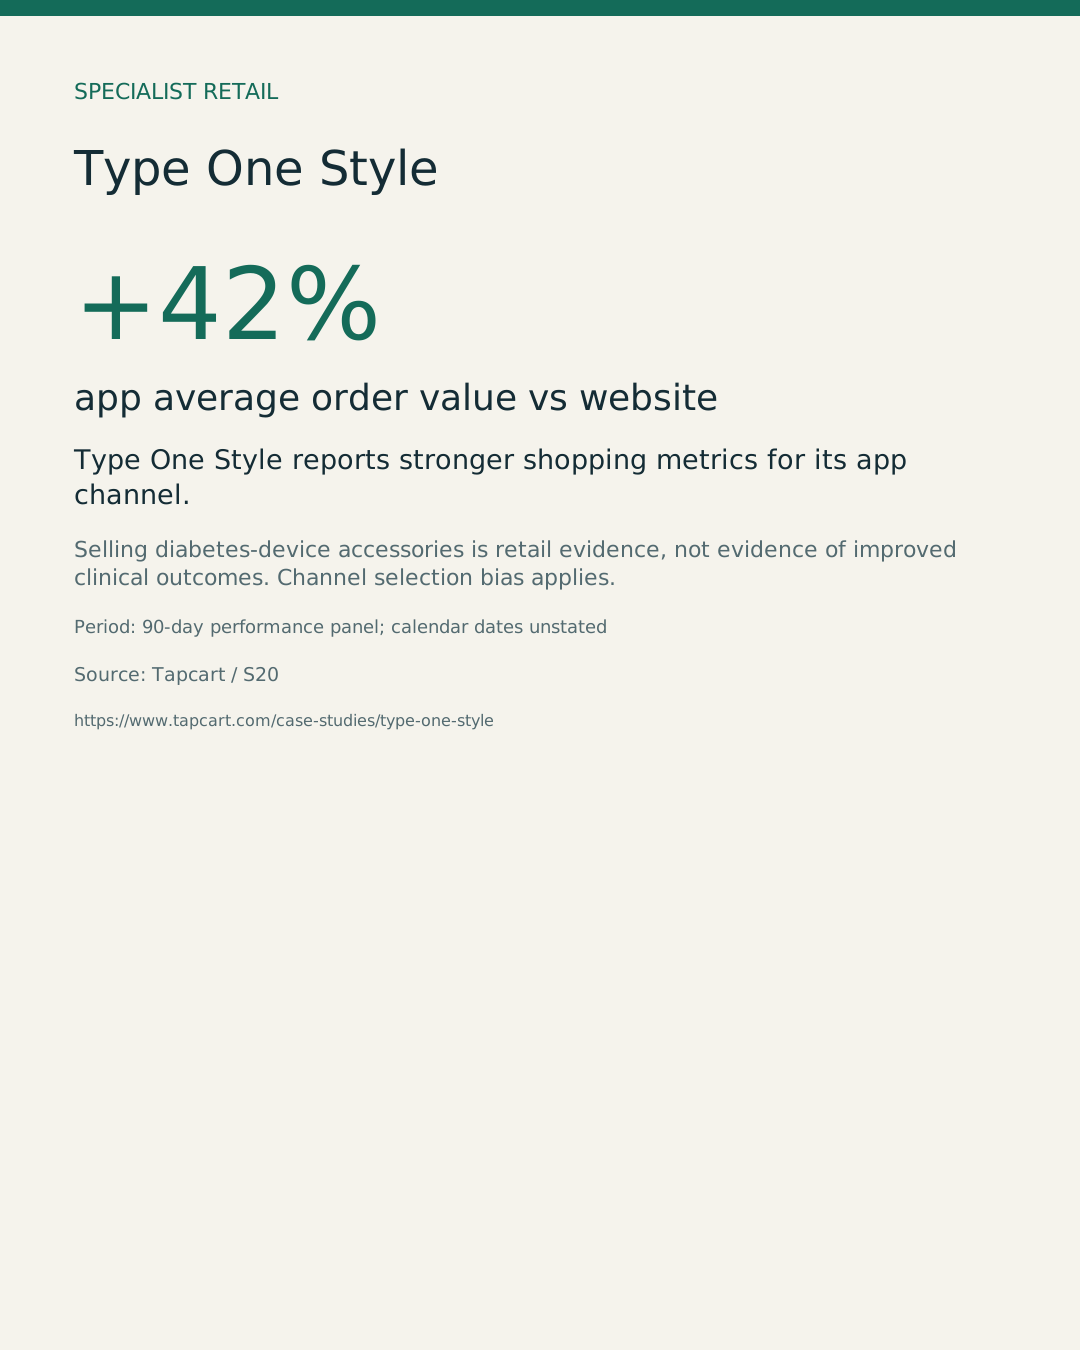
+42% app average order value vs website
Source: Tapcart. Selling diabetes-device accessories is retail evidence, not evidence of improved clinical outcomes. Channel selection bias applies.
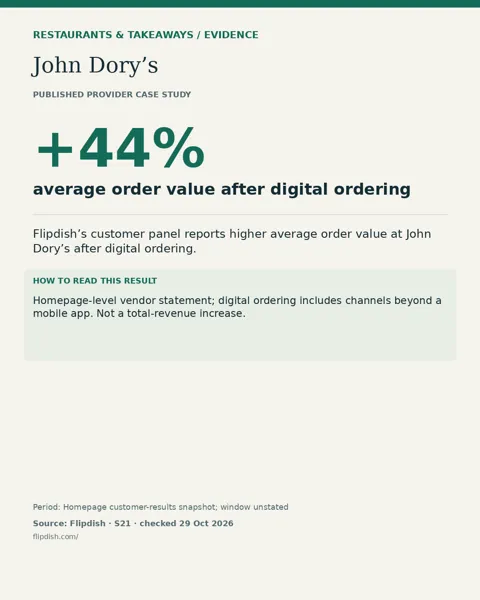
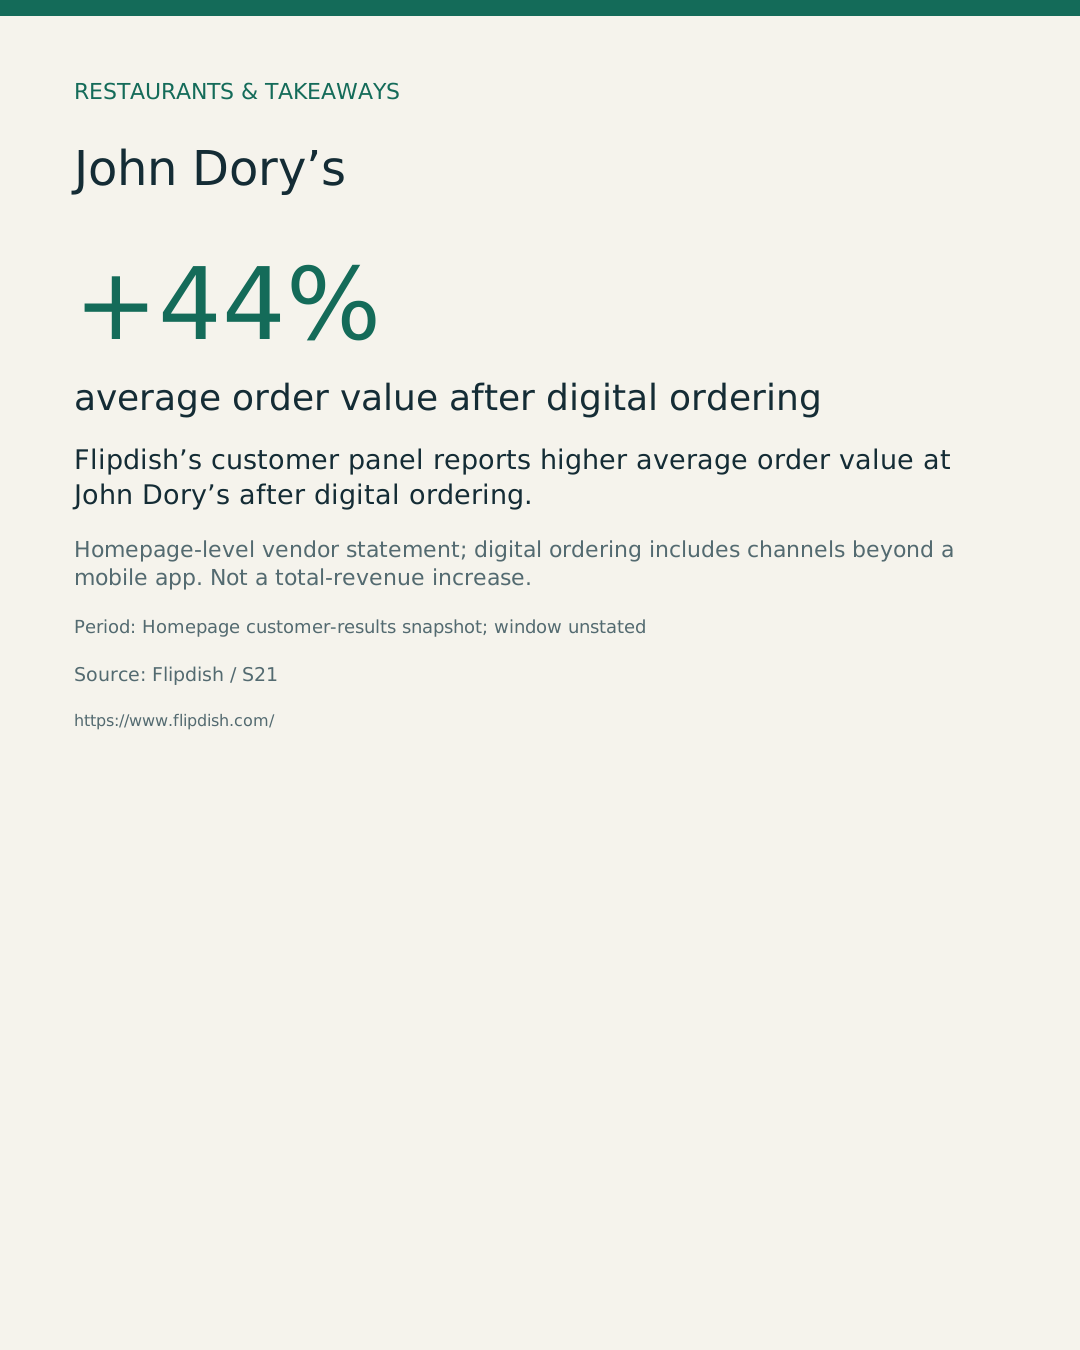
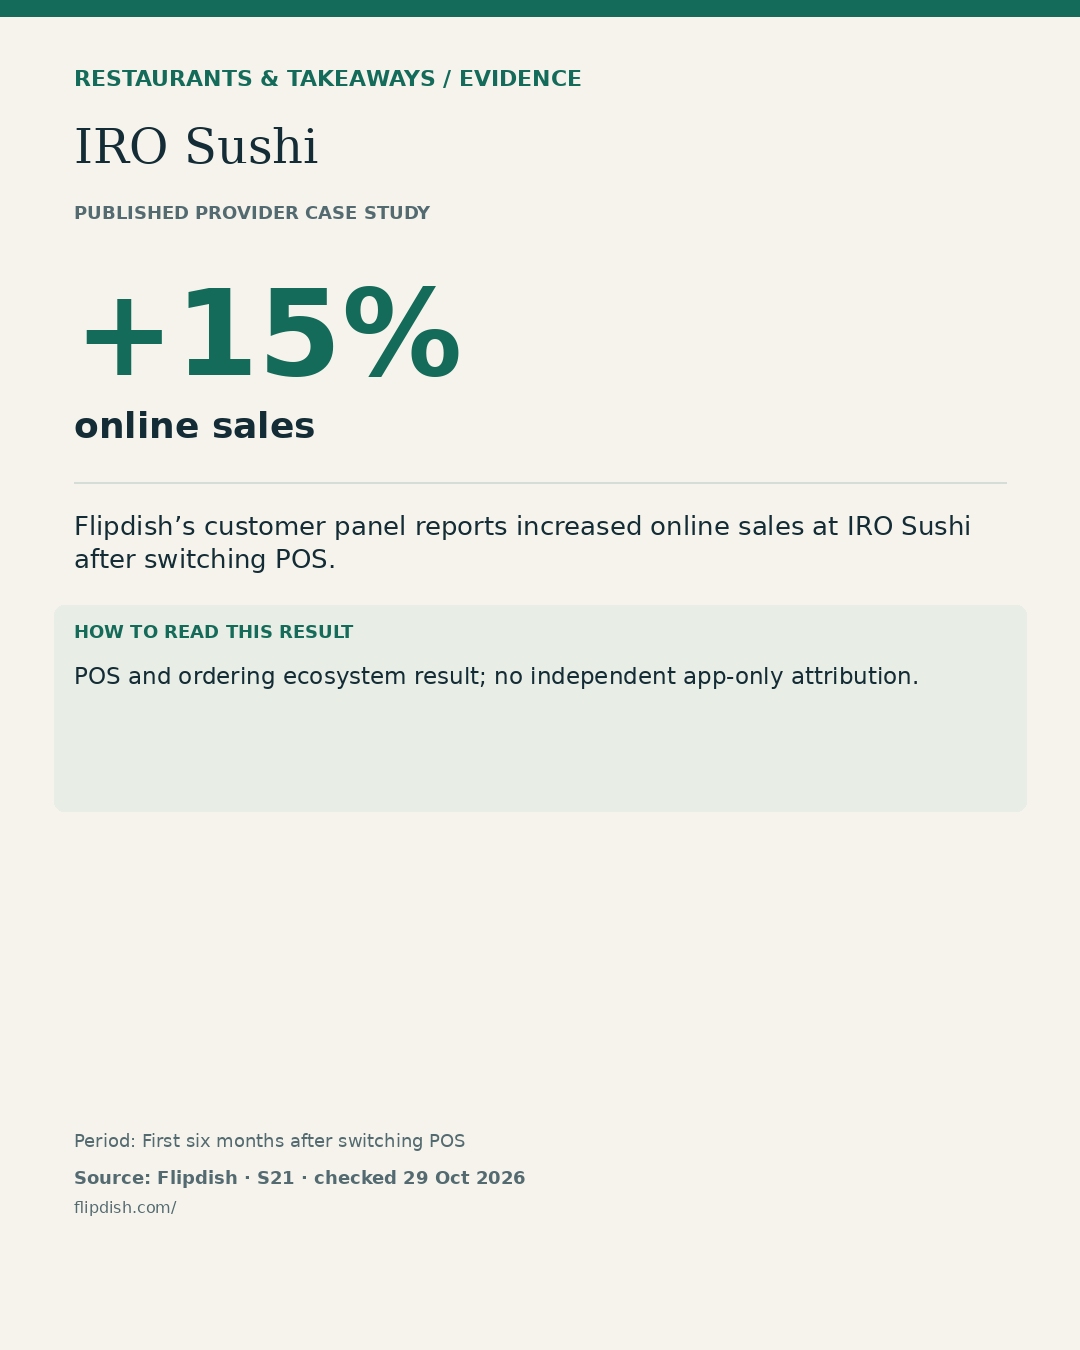
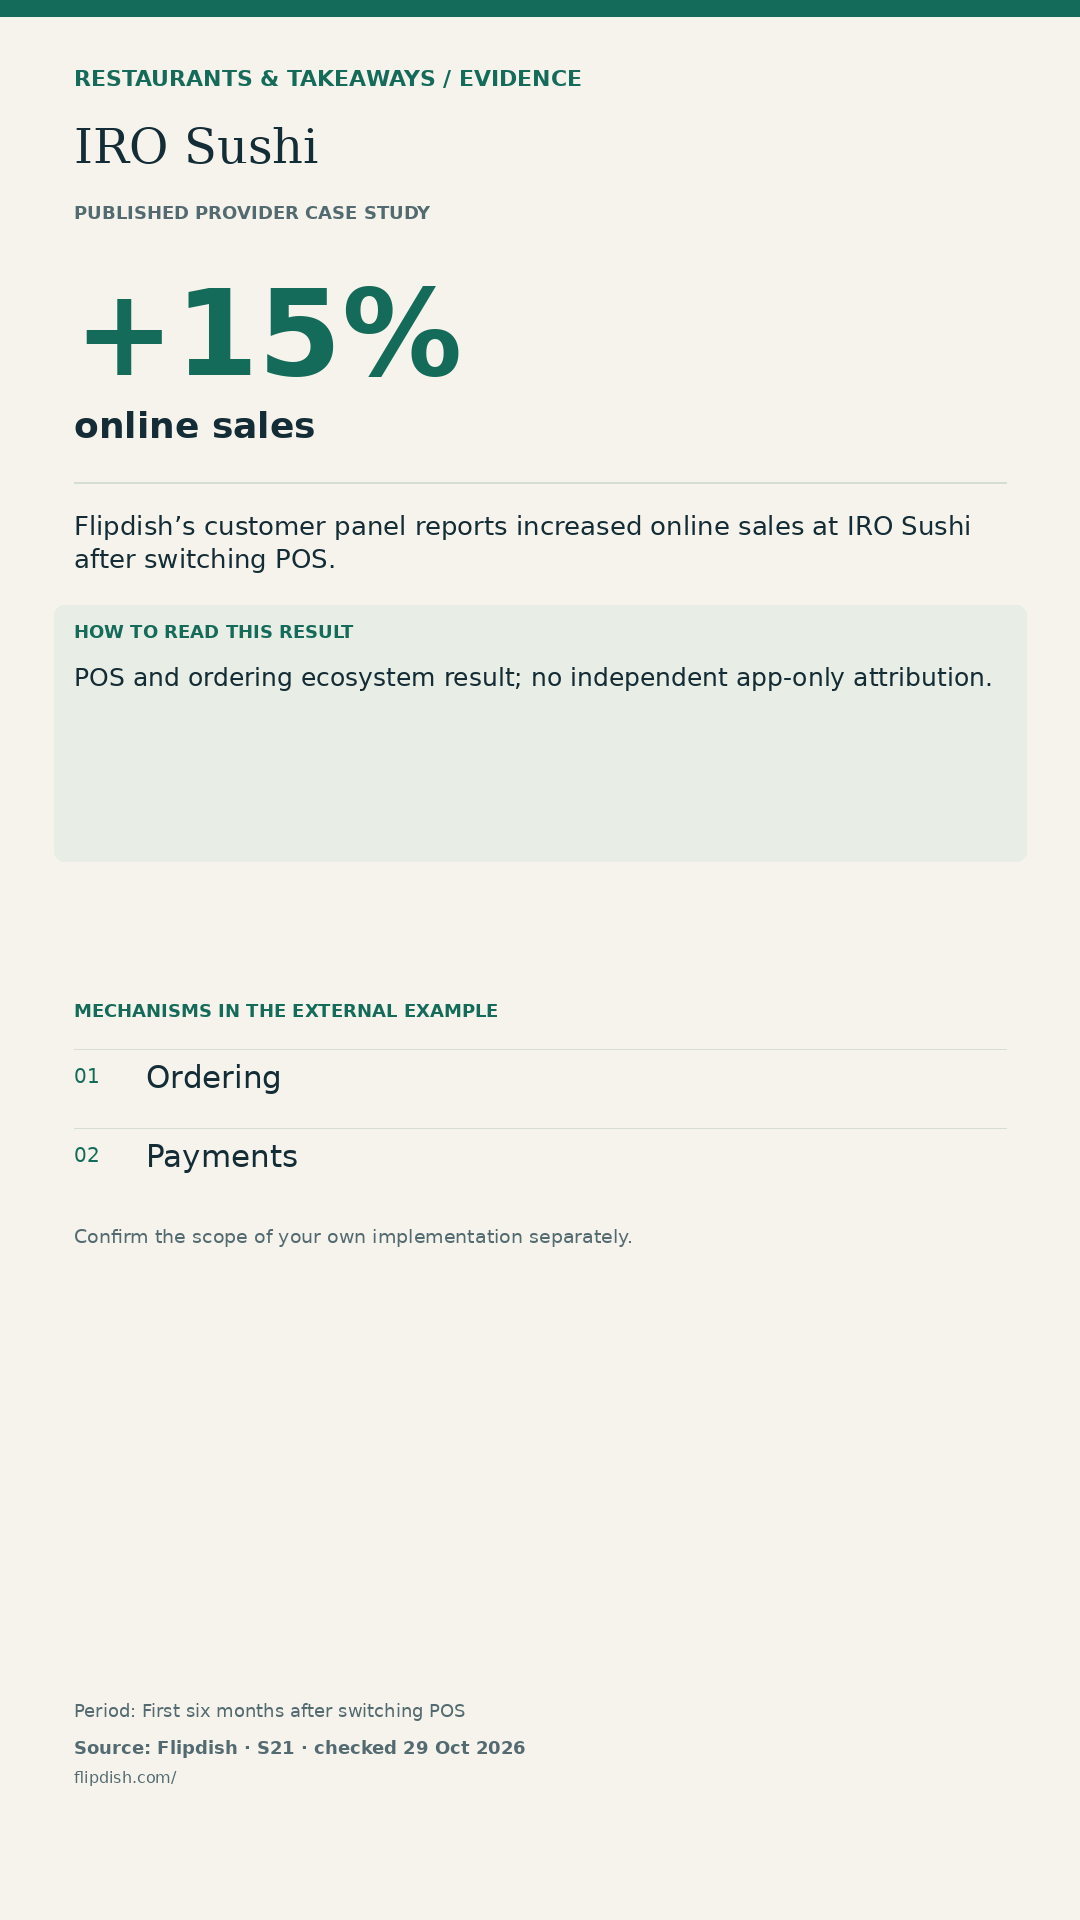
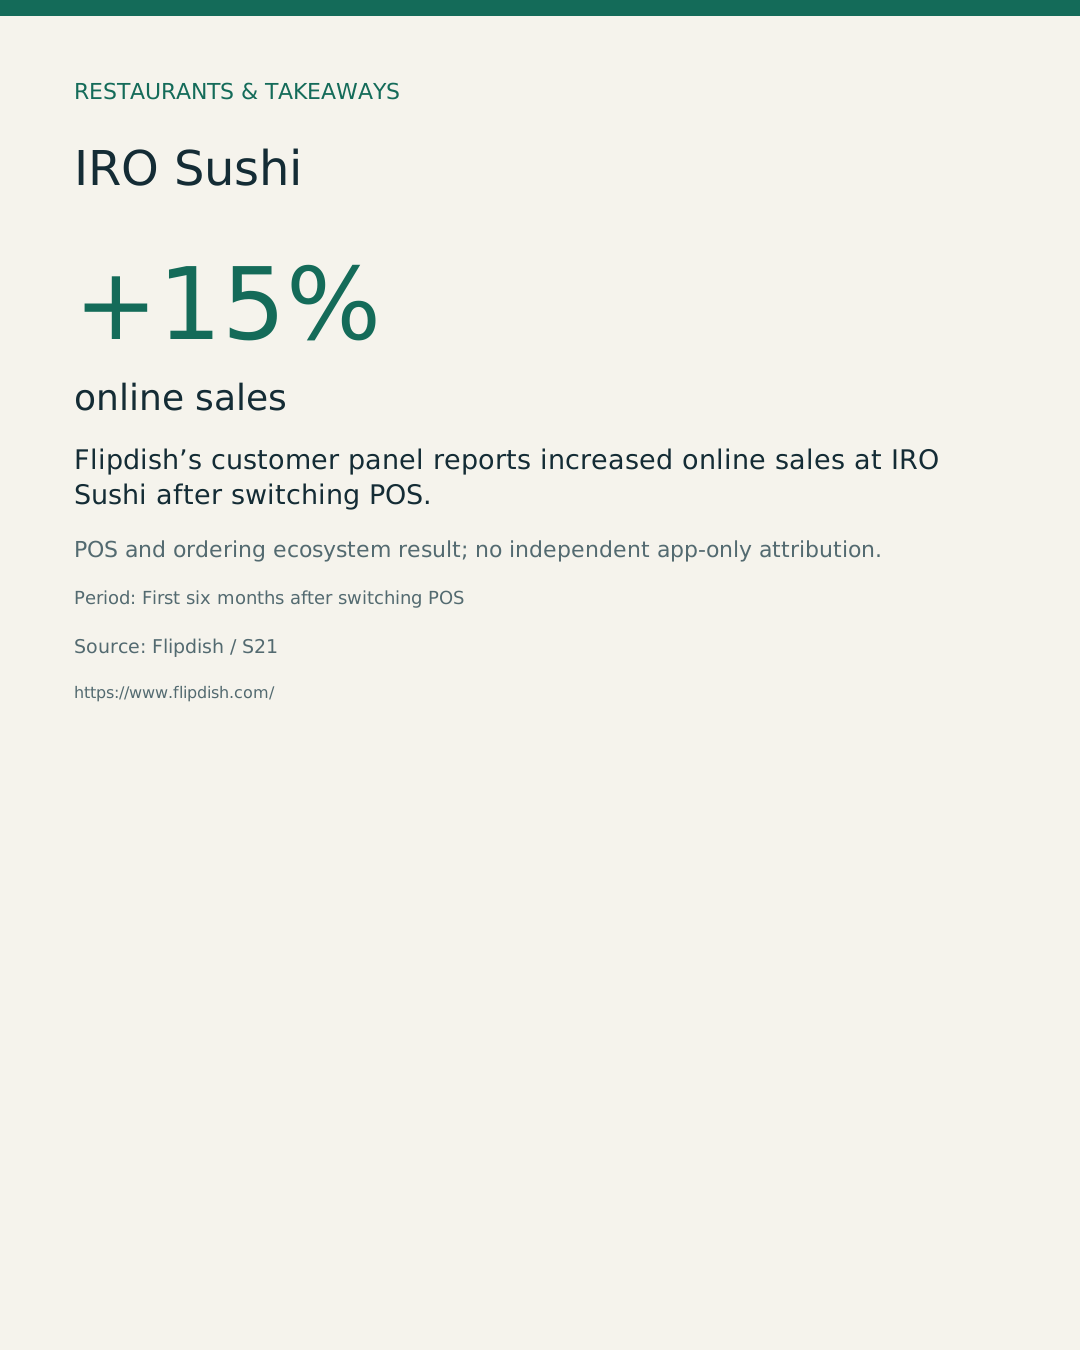
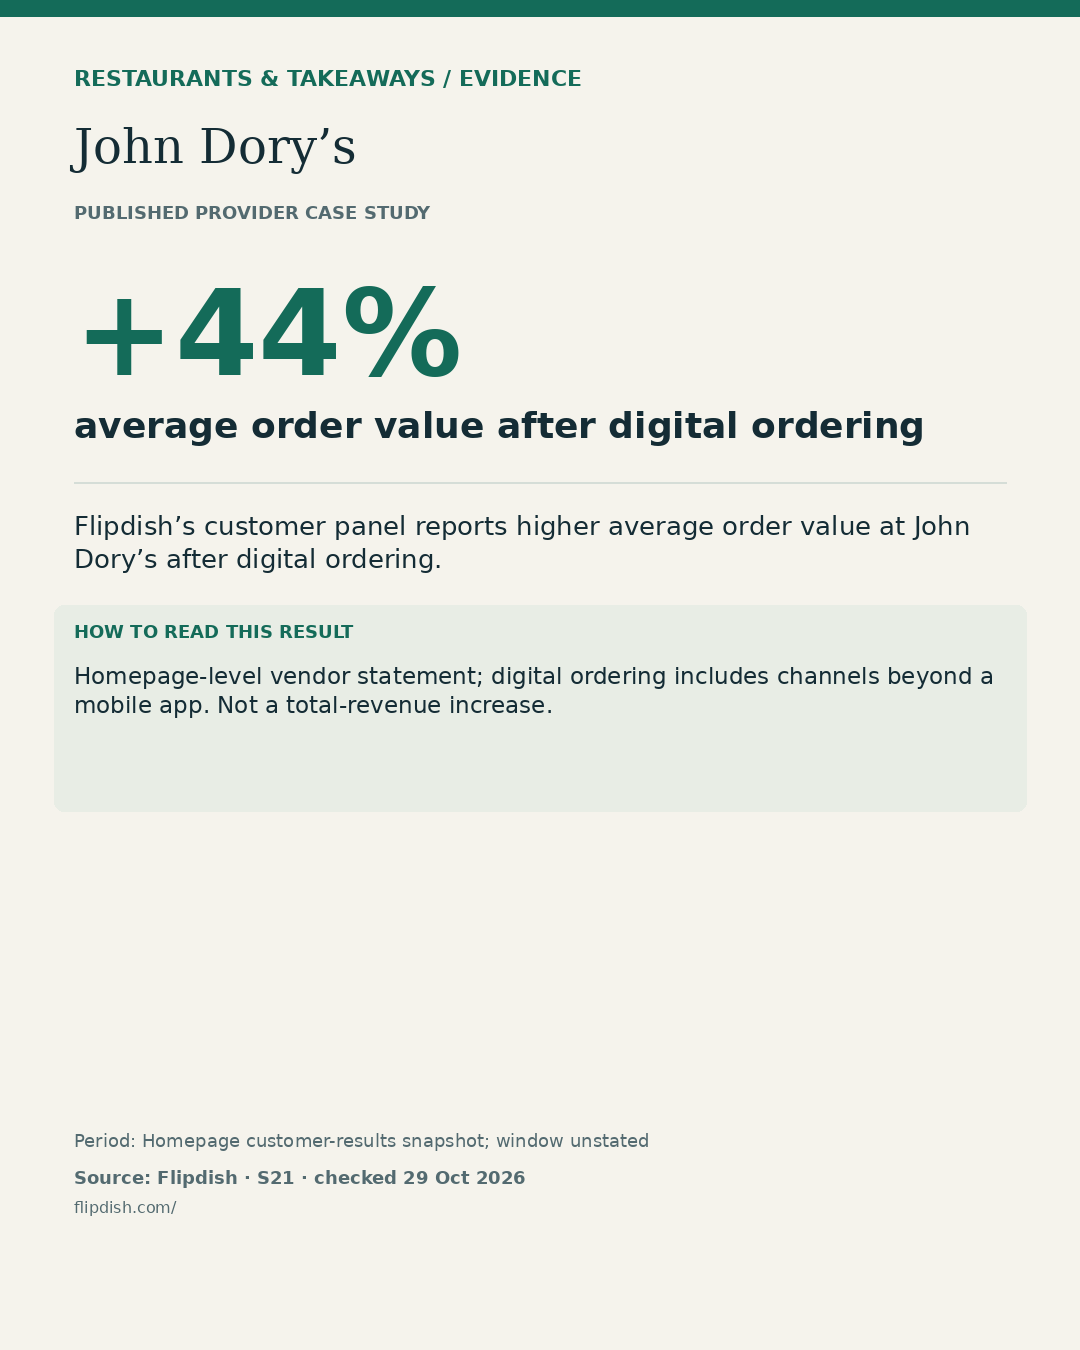
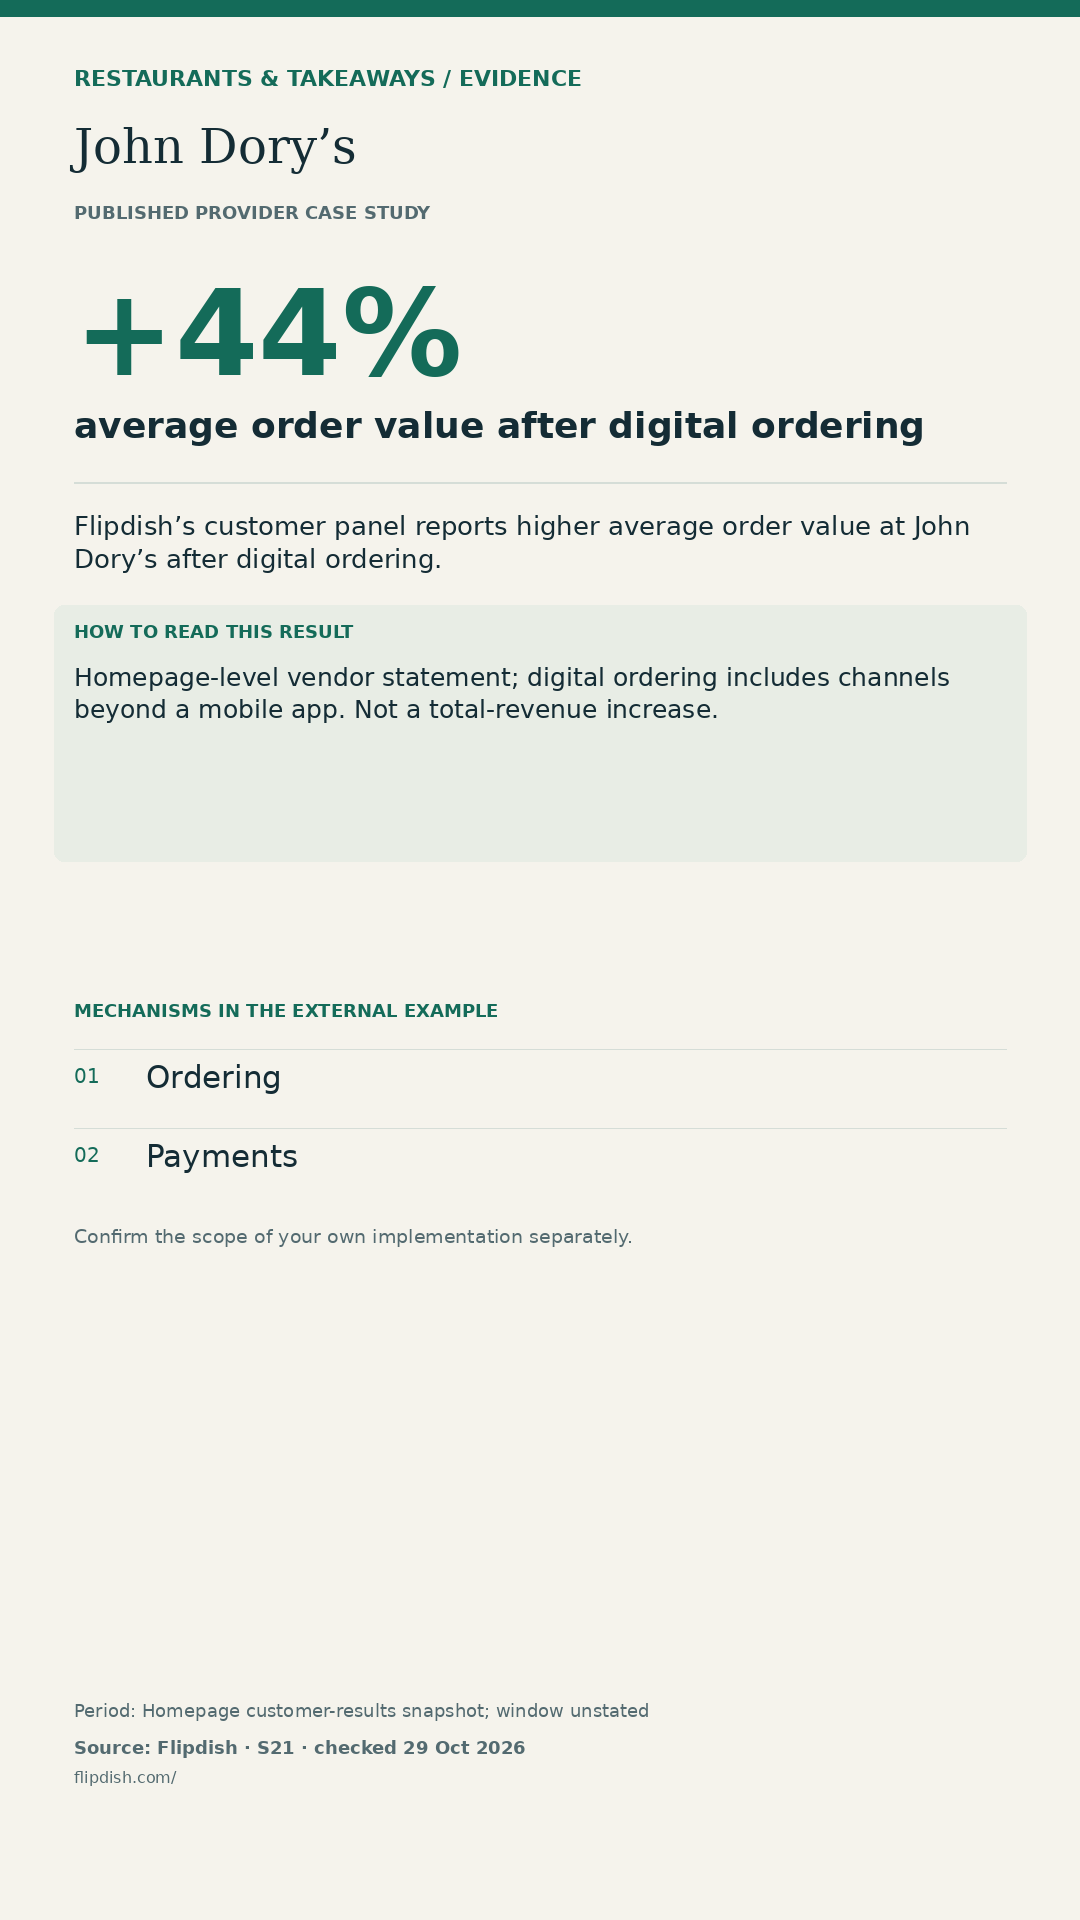
+44% average order value after digital ordering
Source: Flipdish. Homepage-level vendor statement; digital ordering includes channels beyond a mobile app. Not a total-revenue increase.
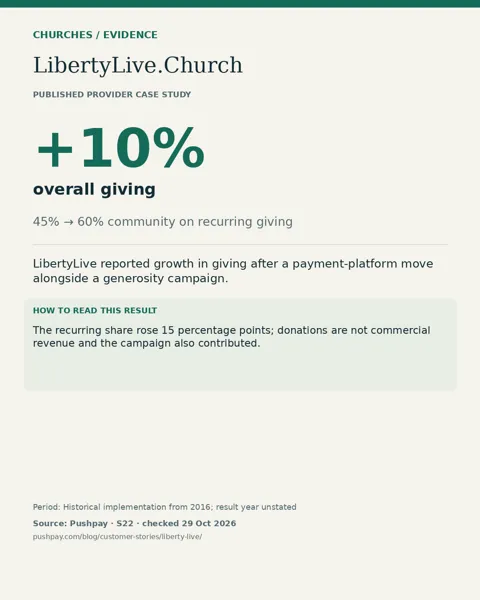
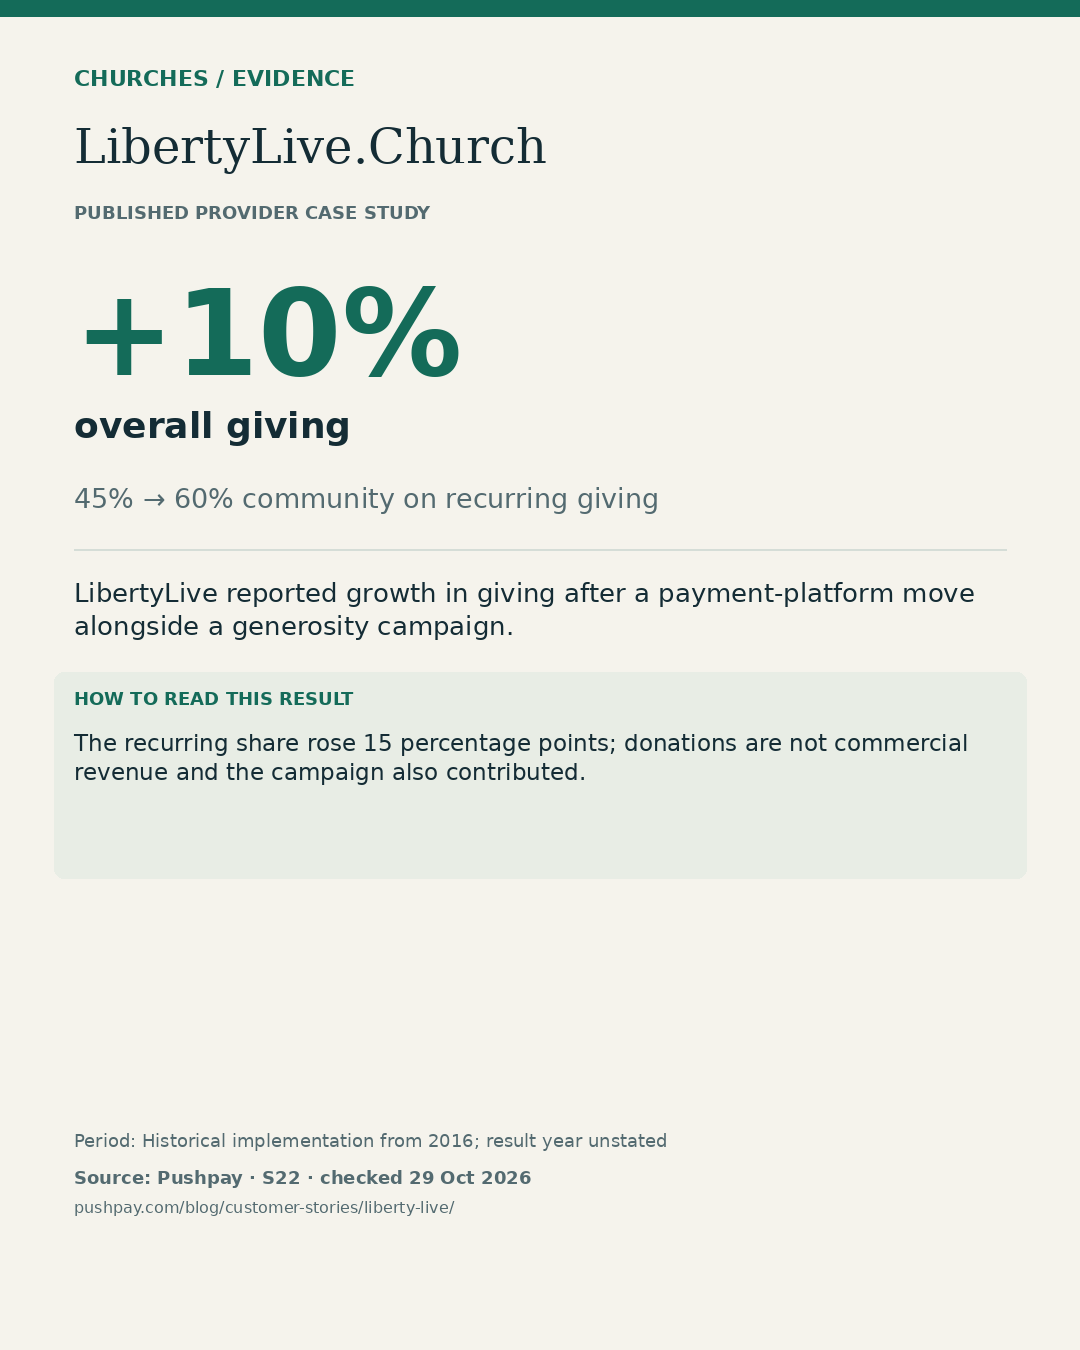
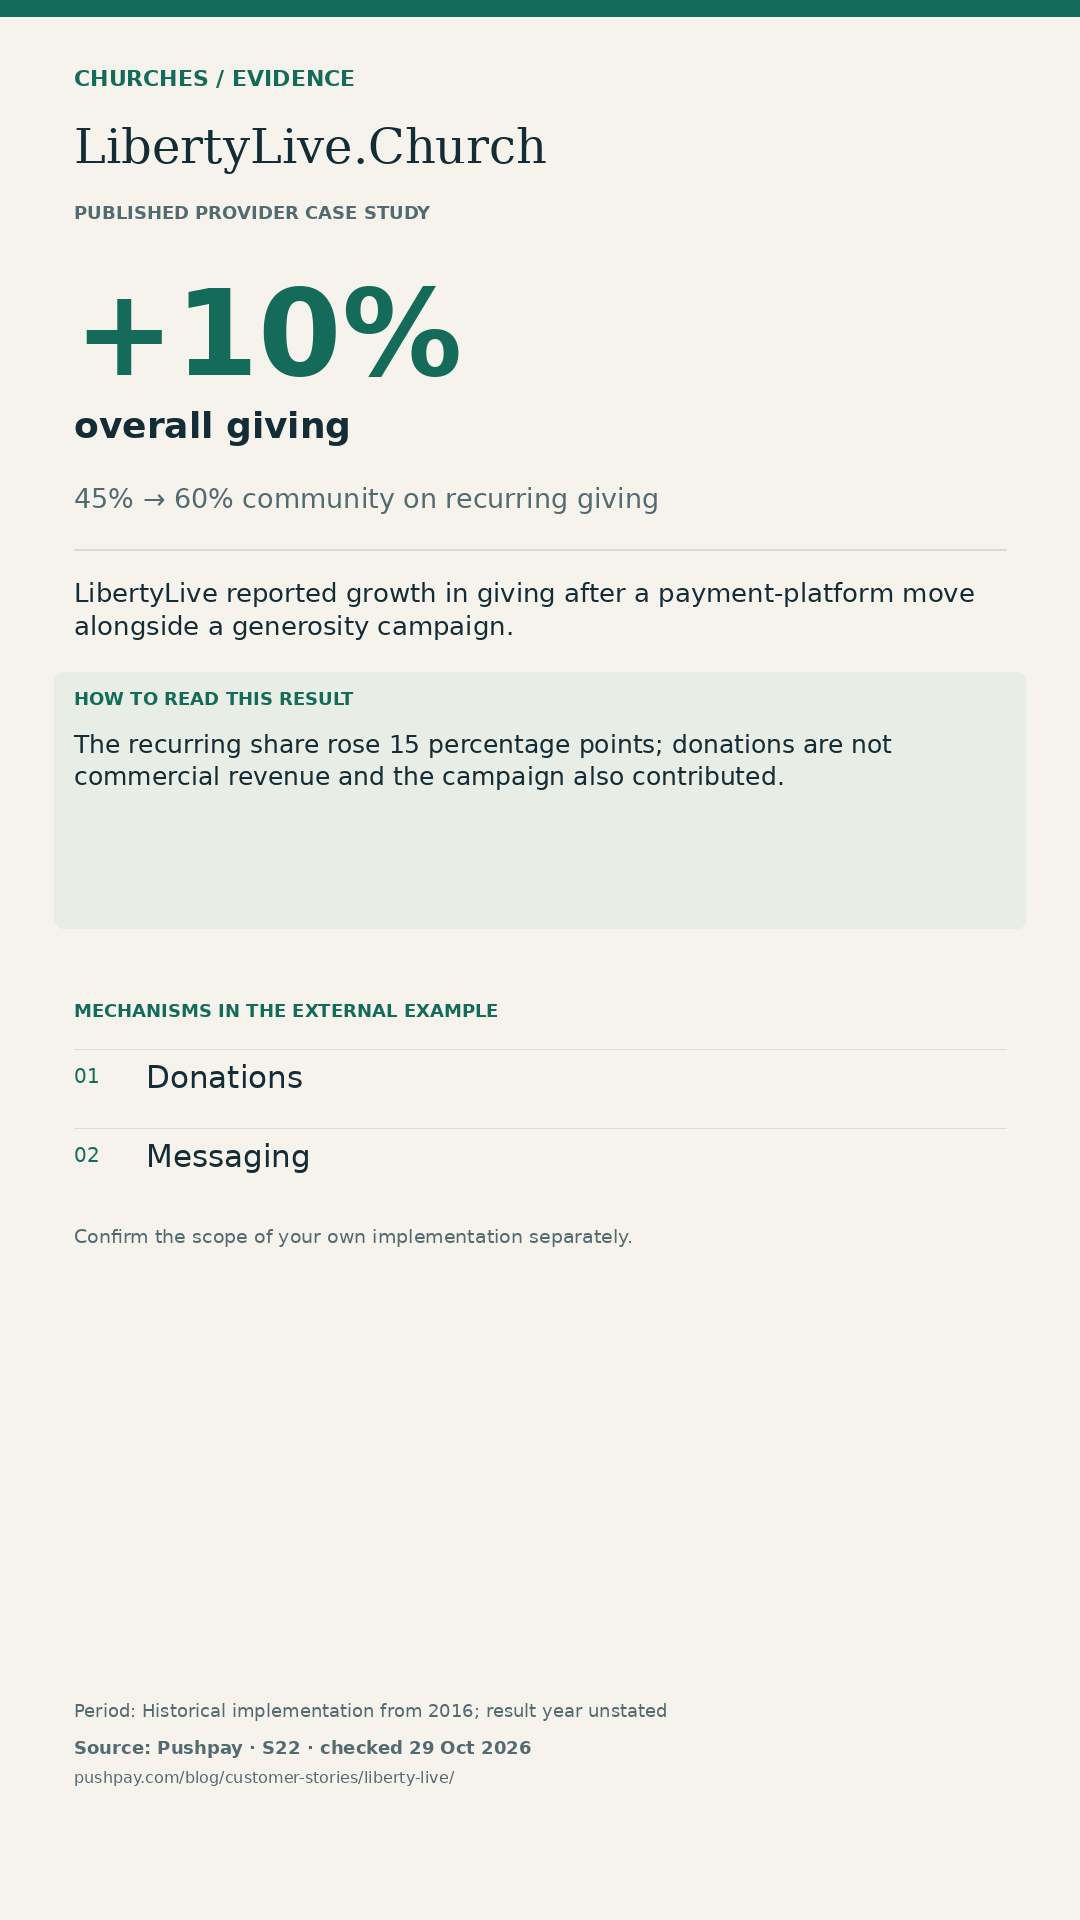
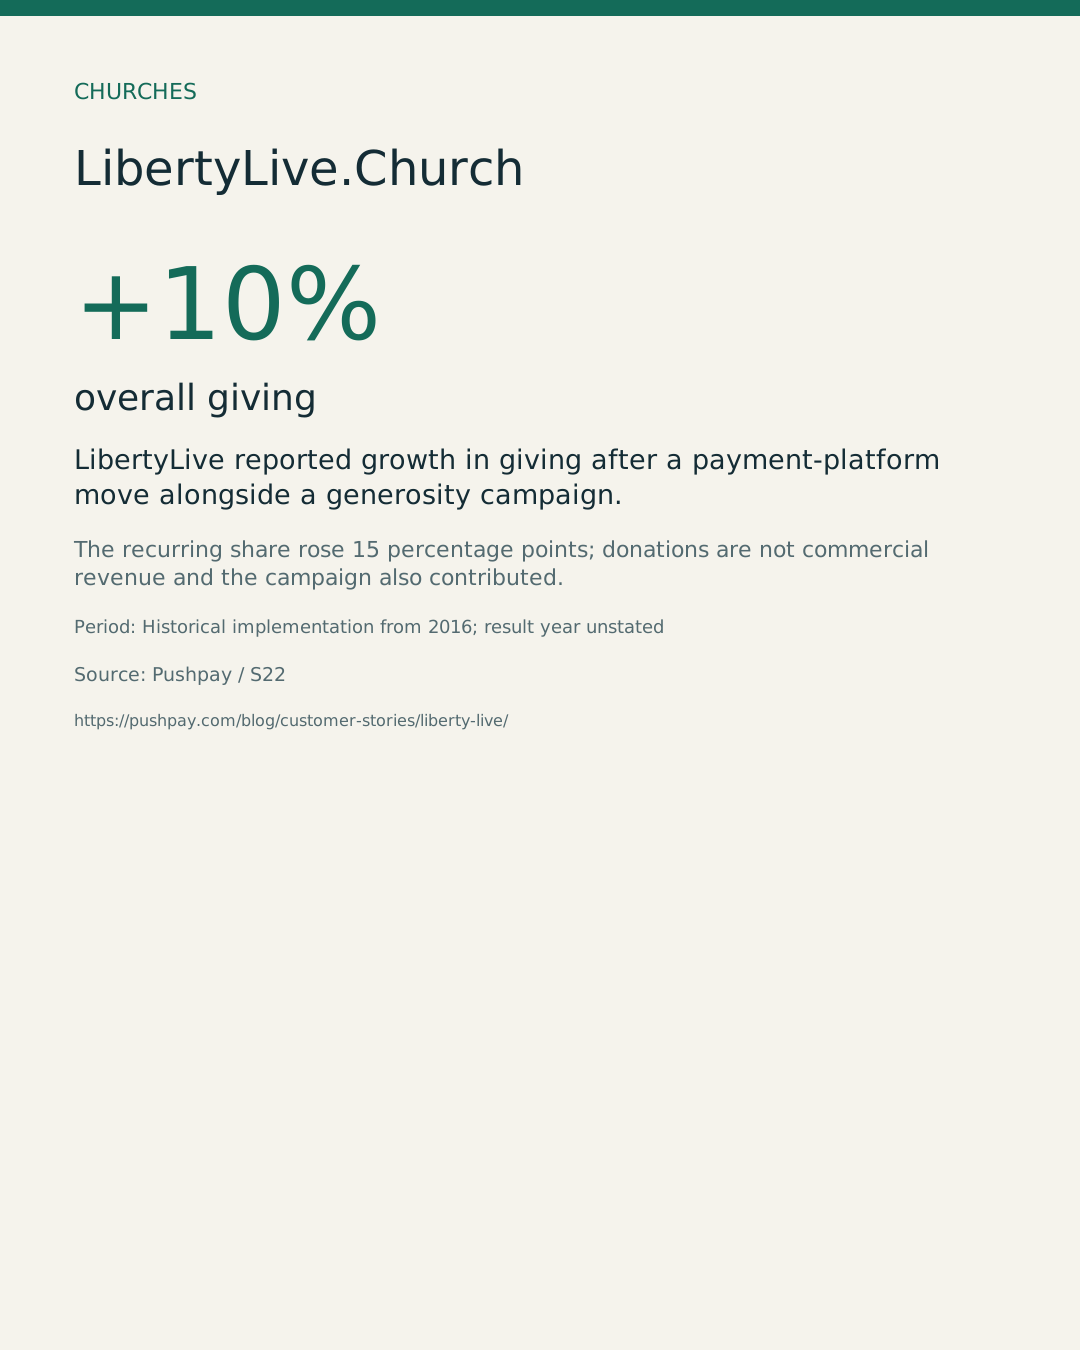
+10% overall giving
Source: Pushpay. The recurring share rose 15 percentage points; donations are not commercial revenue and the campaign also contributed.
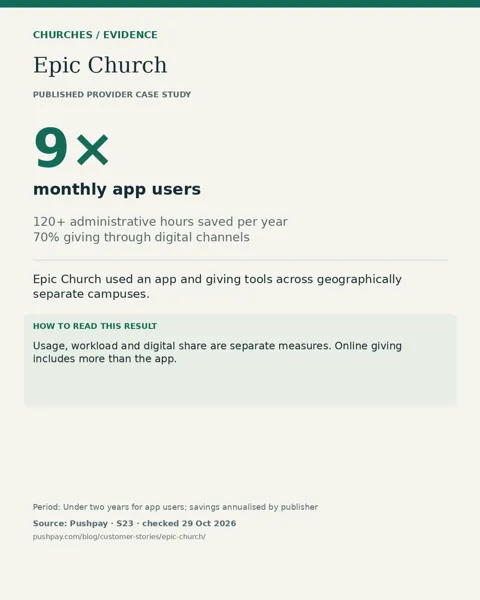
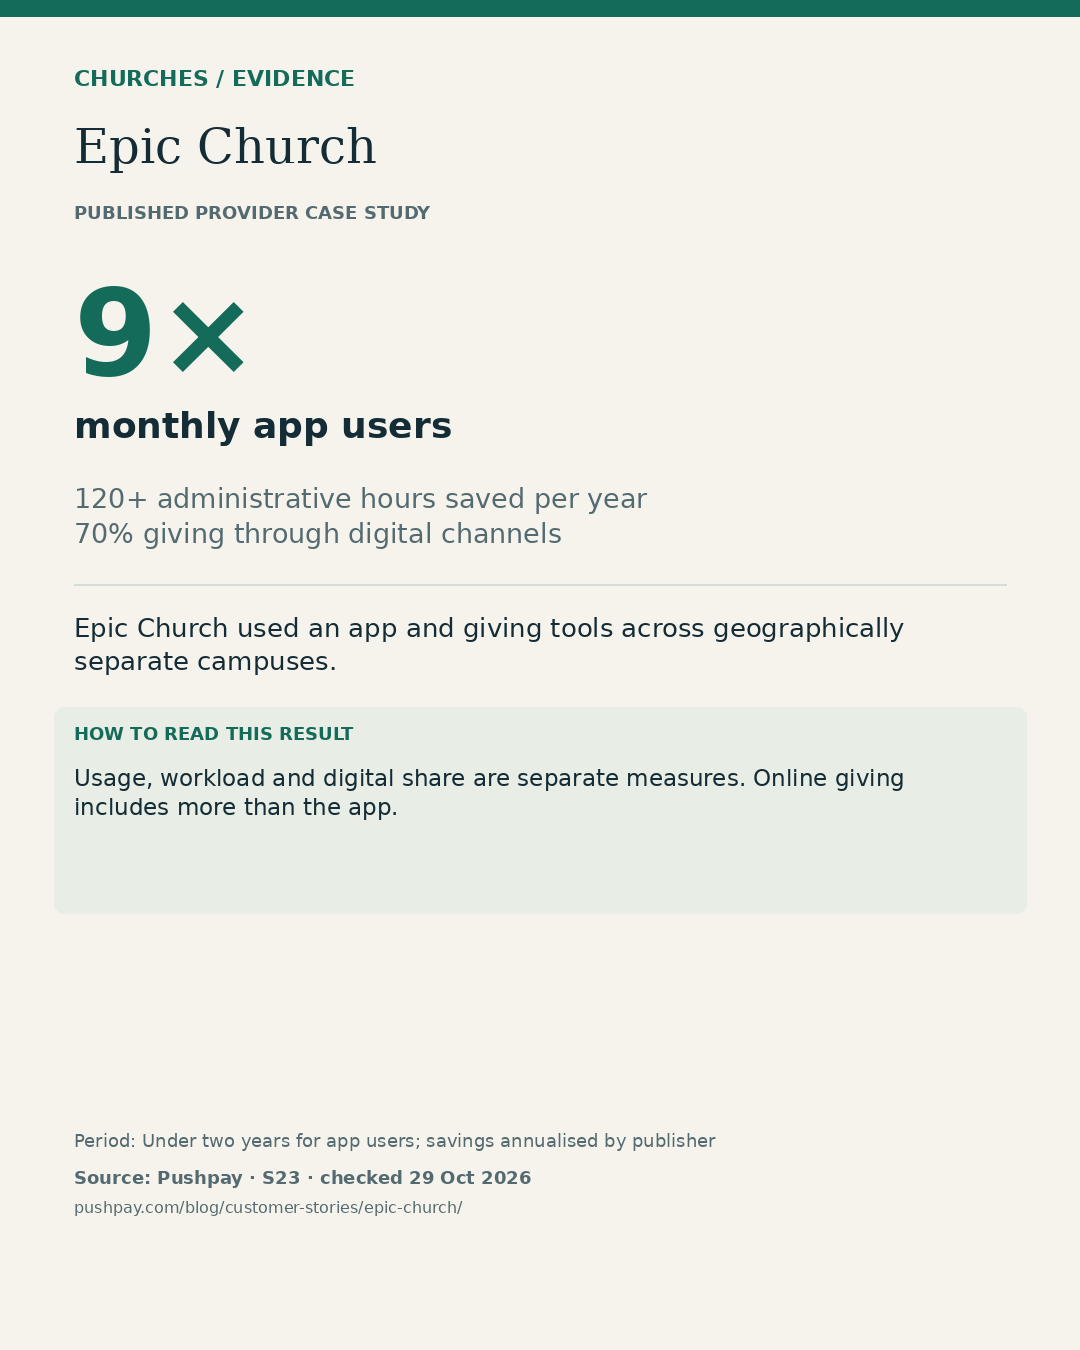
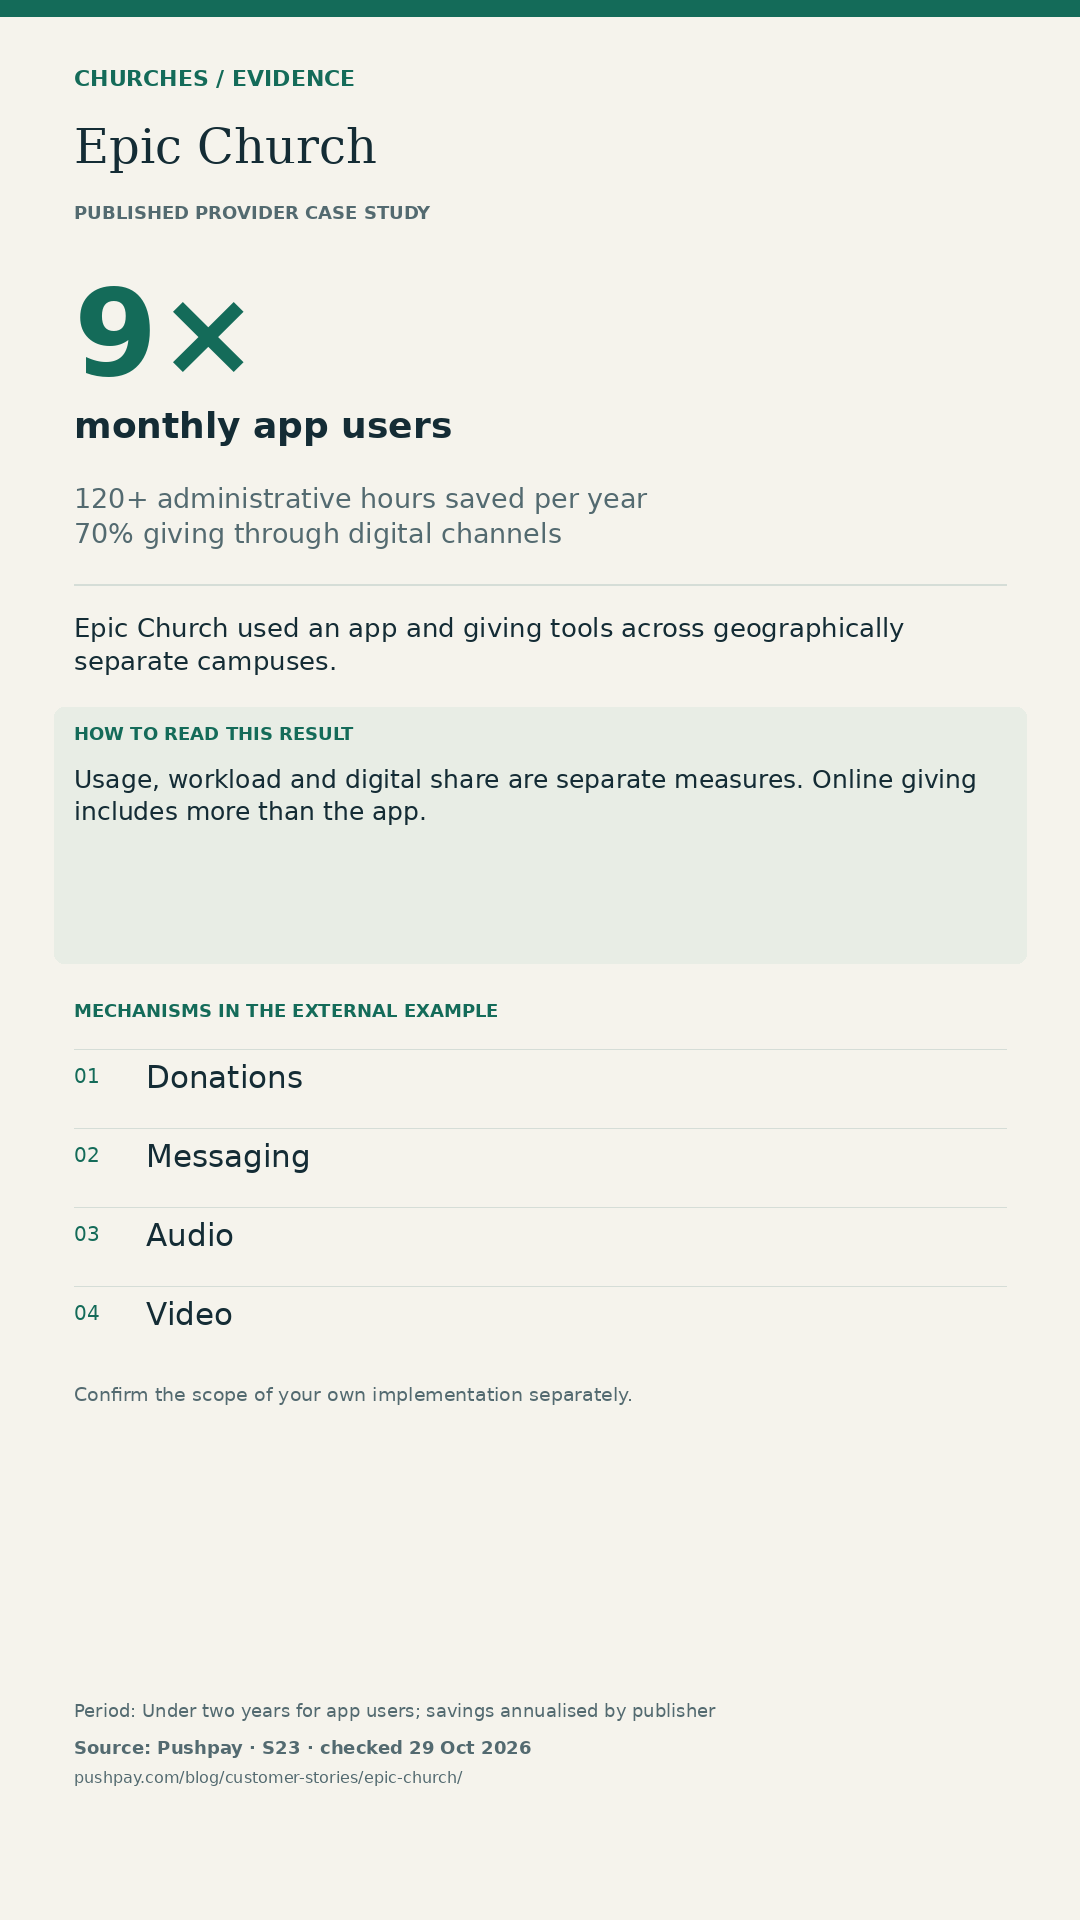
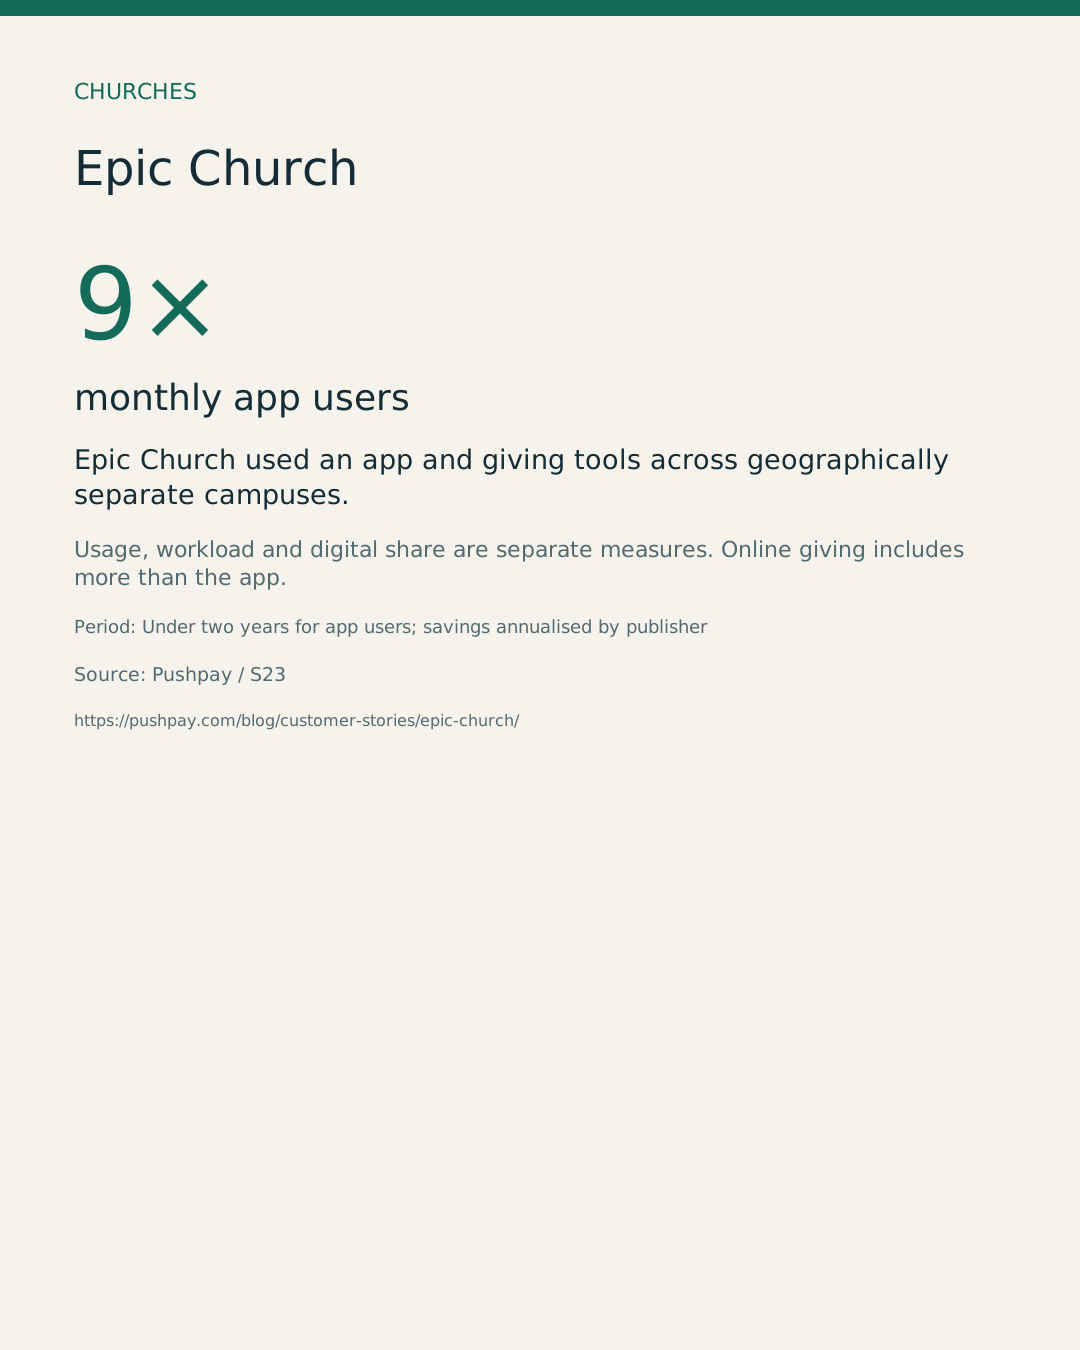
9× monthly app users
Source: Pushpay. Usage, workload and digital share are separate measures. Online giving includes more than the app.
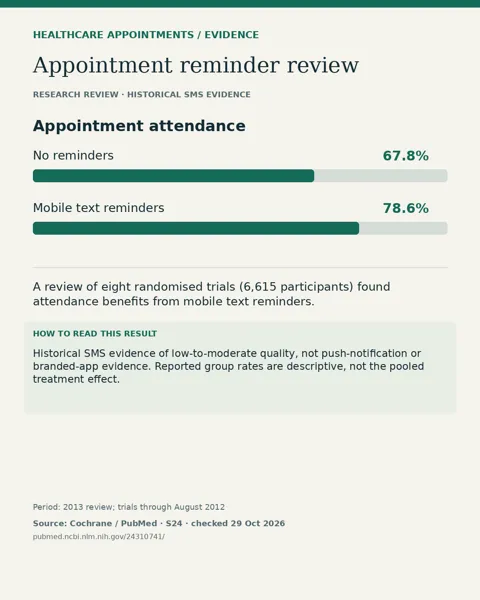
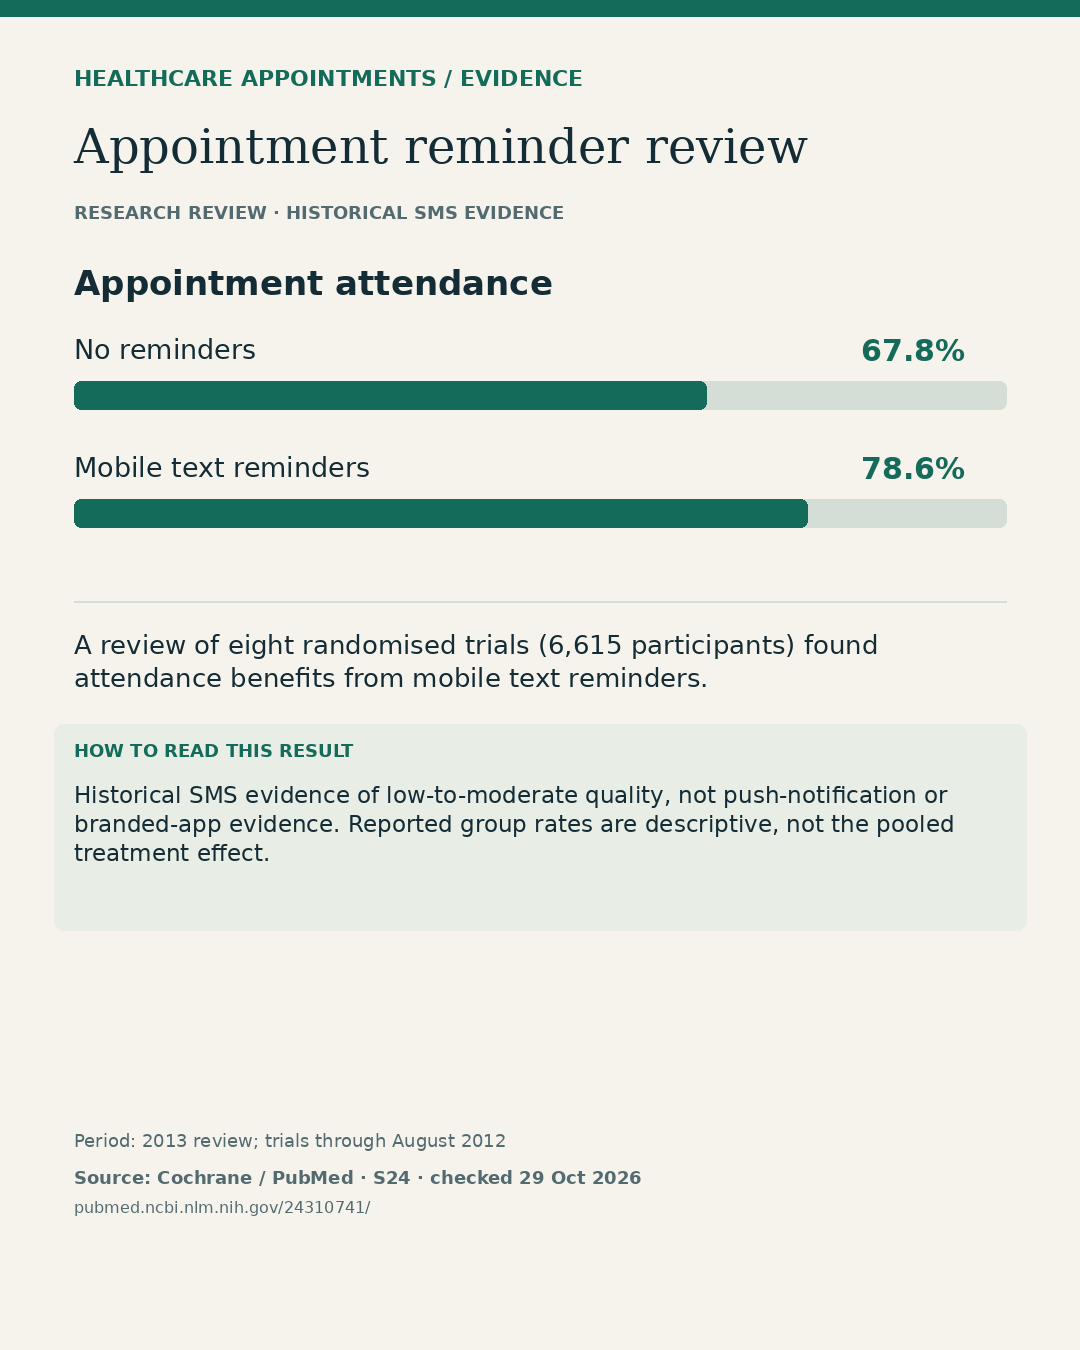
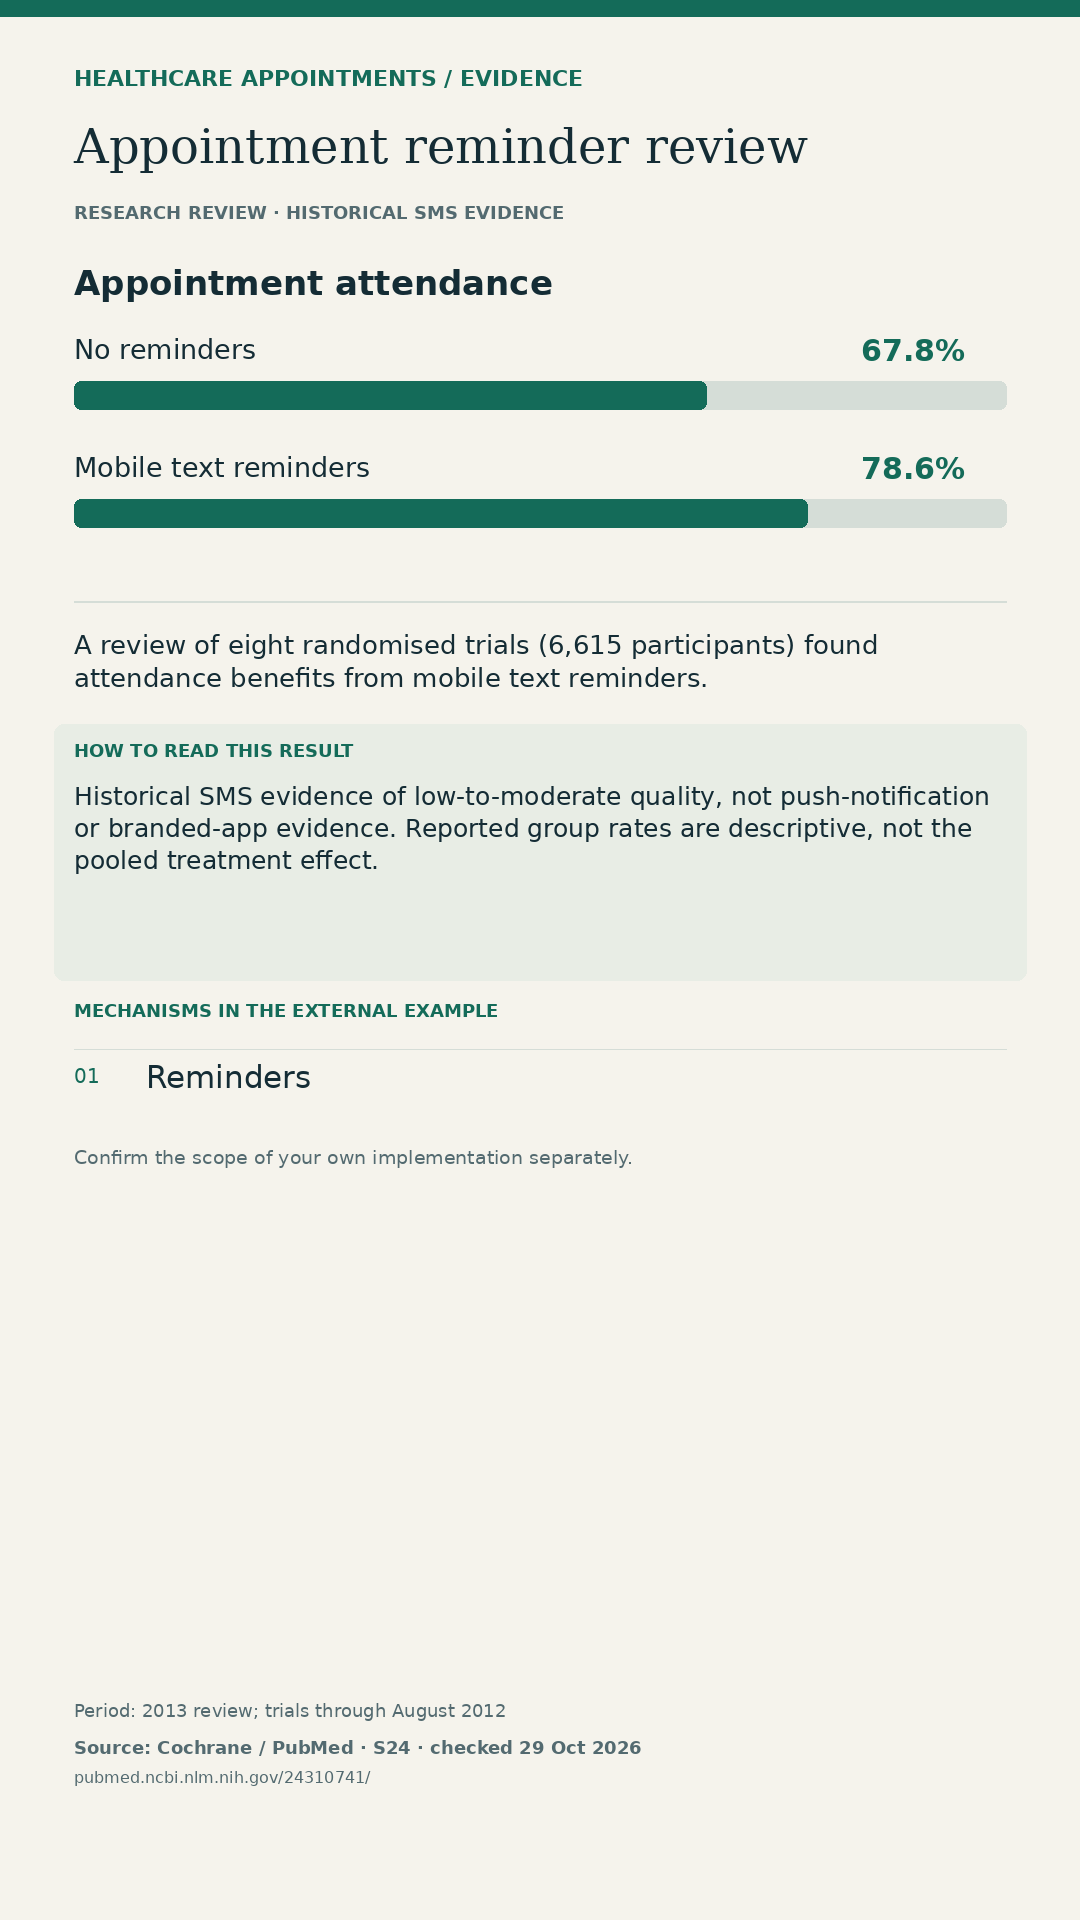
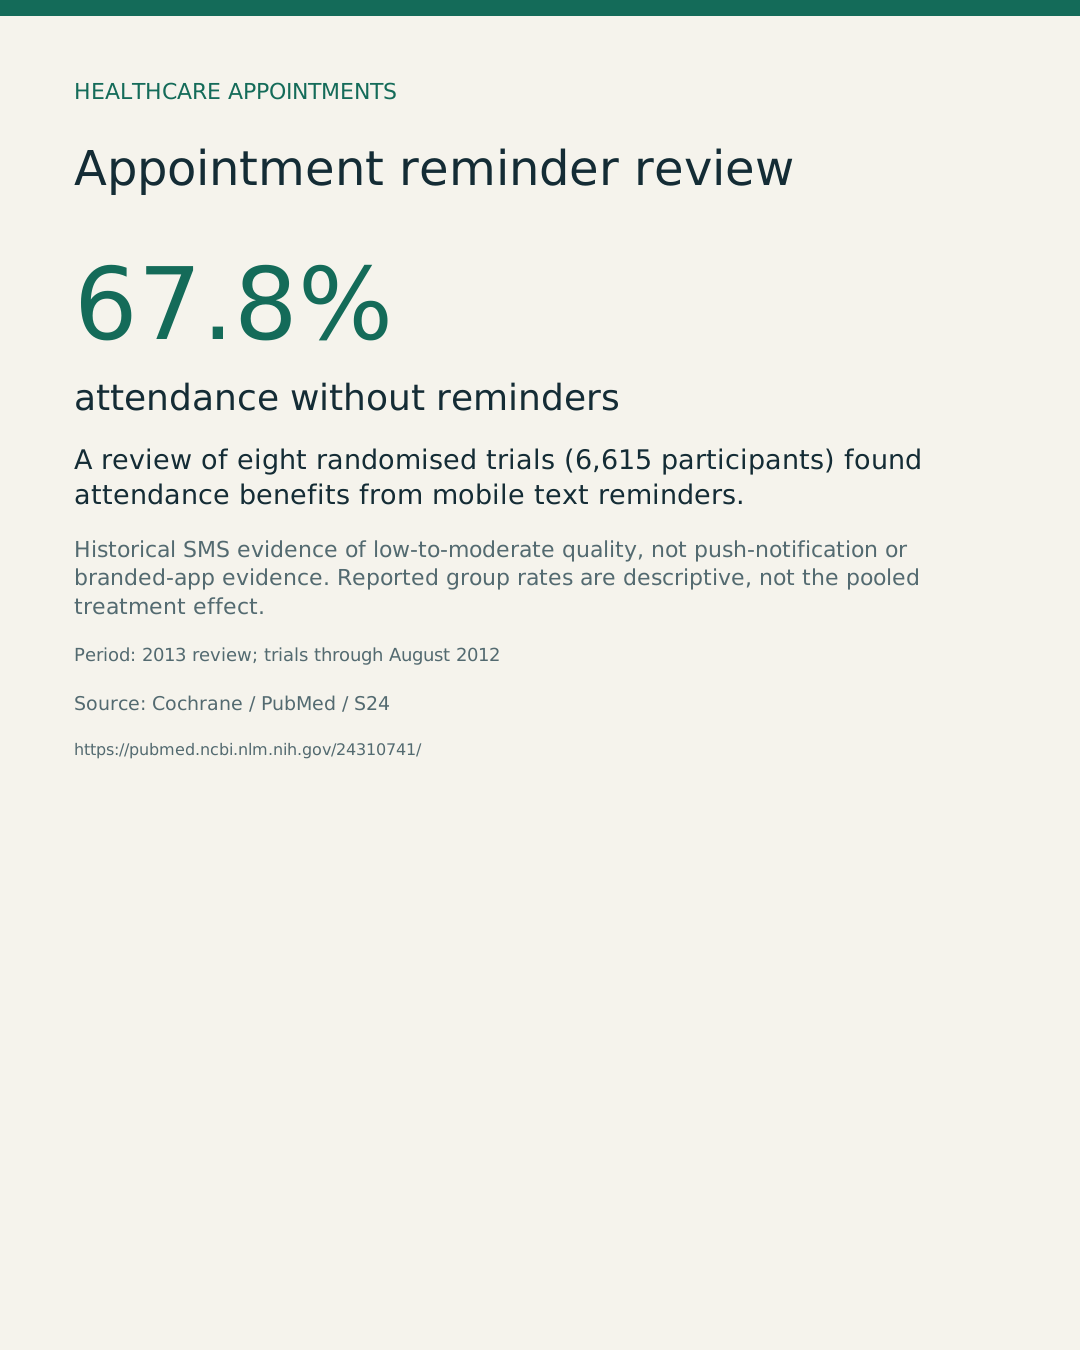
67.8% attendance without reminders
Source: Cochrane / PubMed. Historical SMS evidence of low-to-moderate quality, not push-notification or branded-app evidence. Reported group rates are descriptive, not the pooled treatment effect.
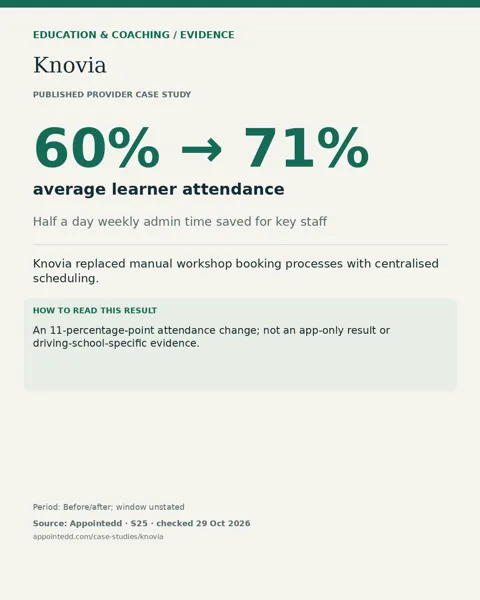
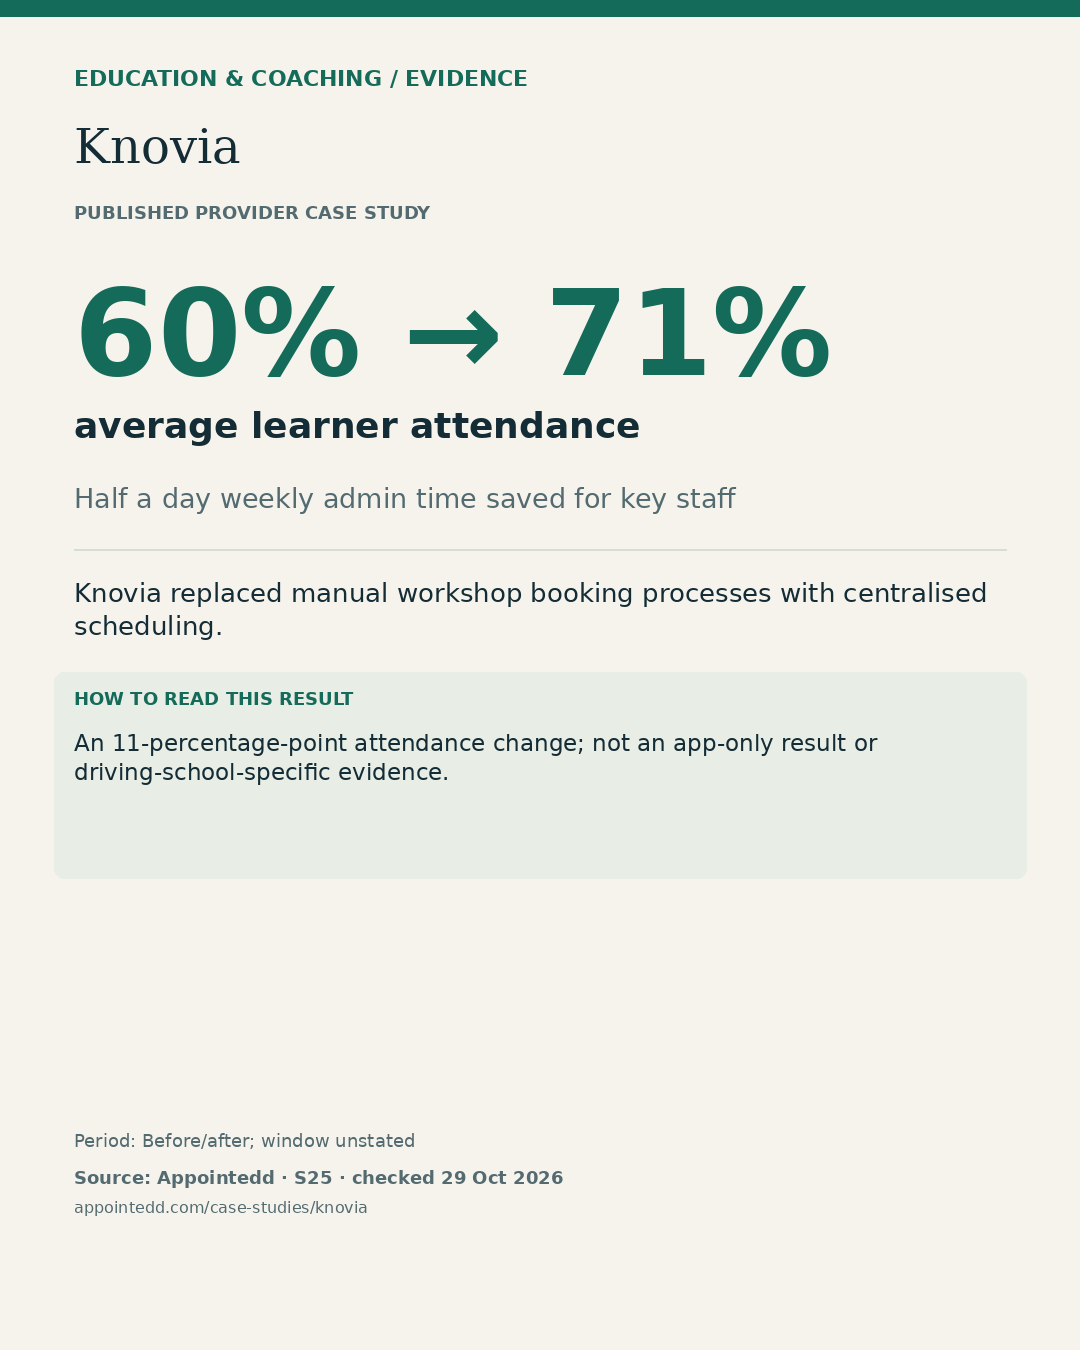
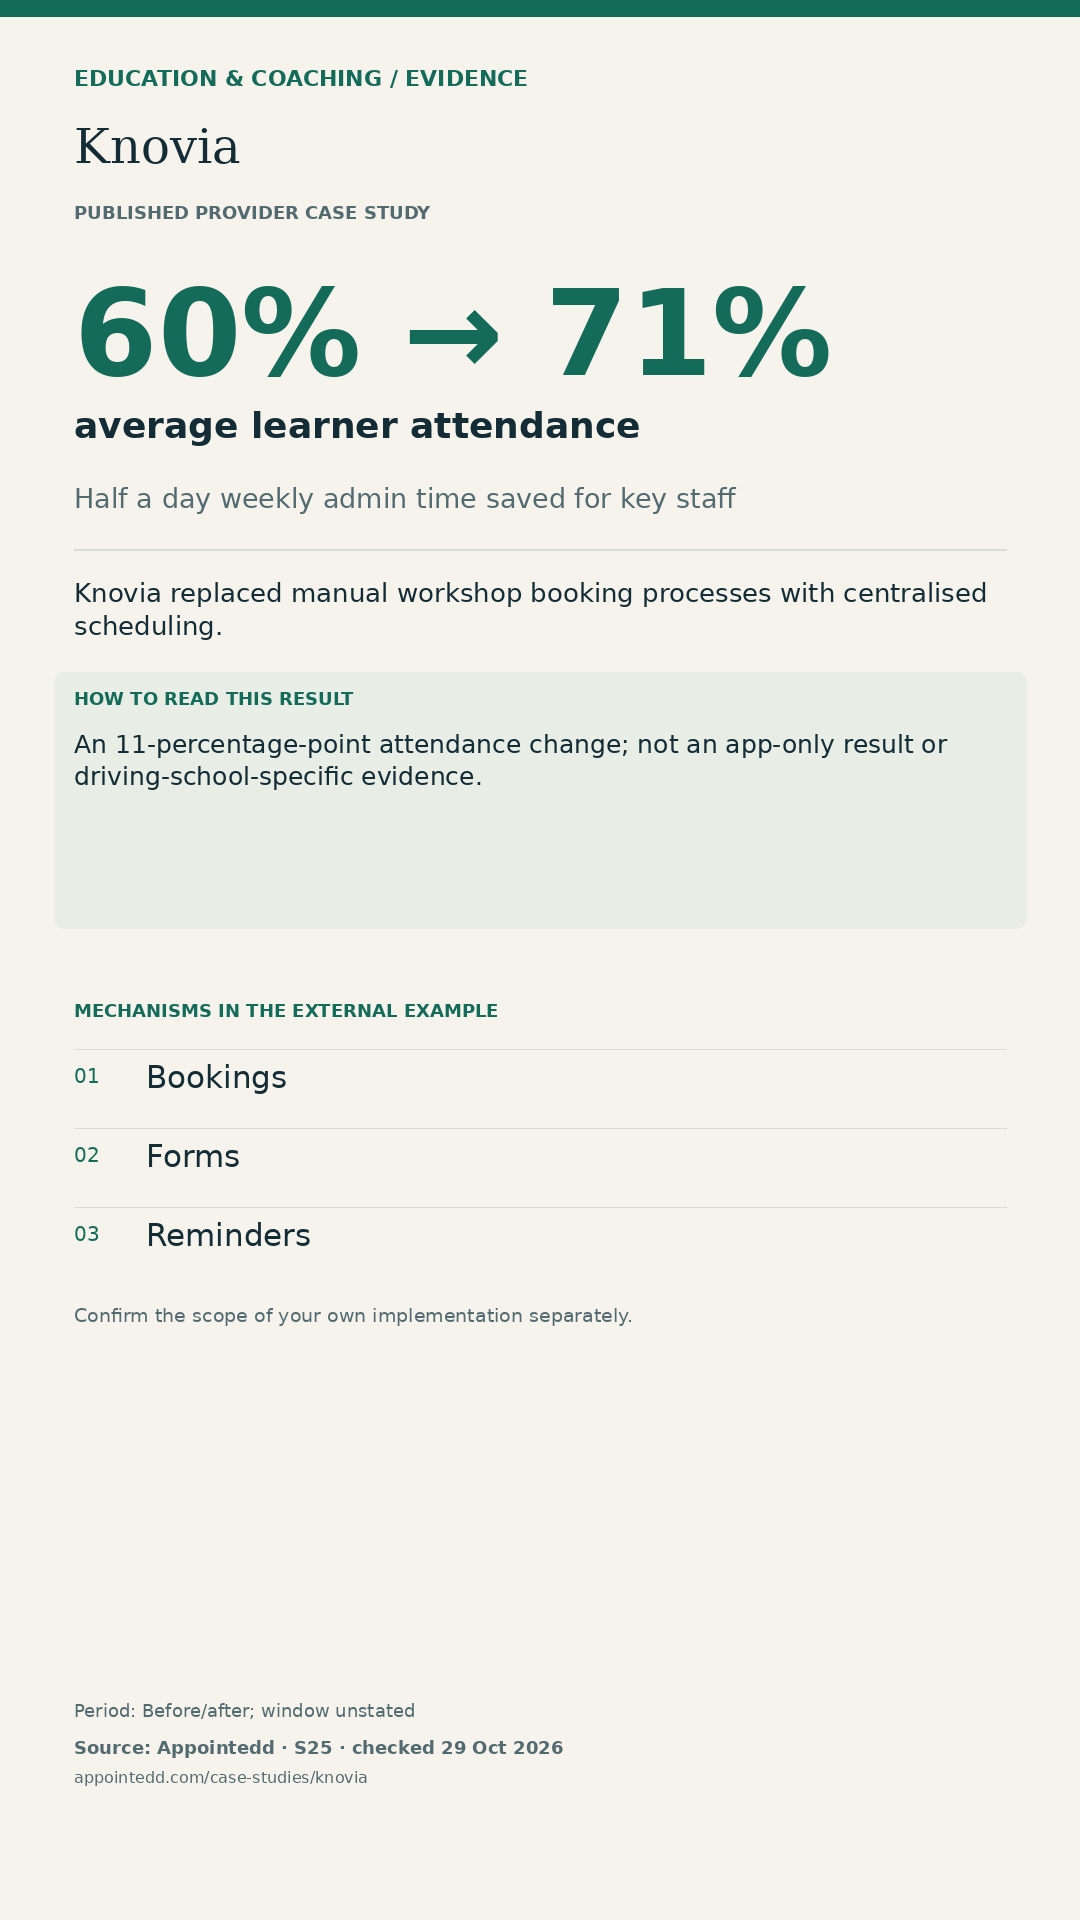
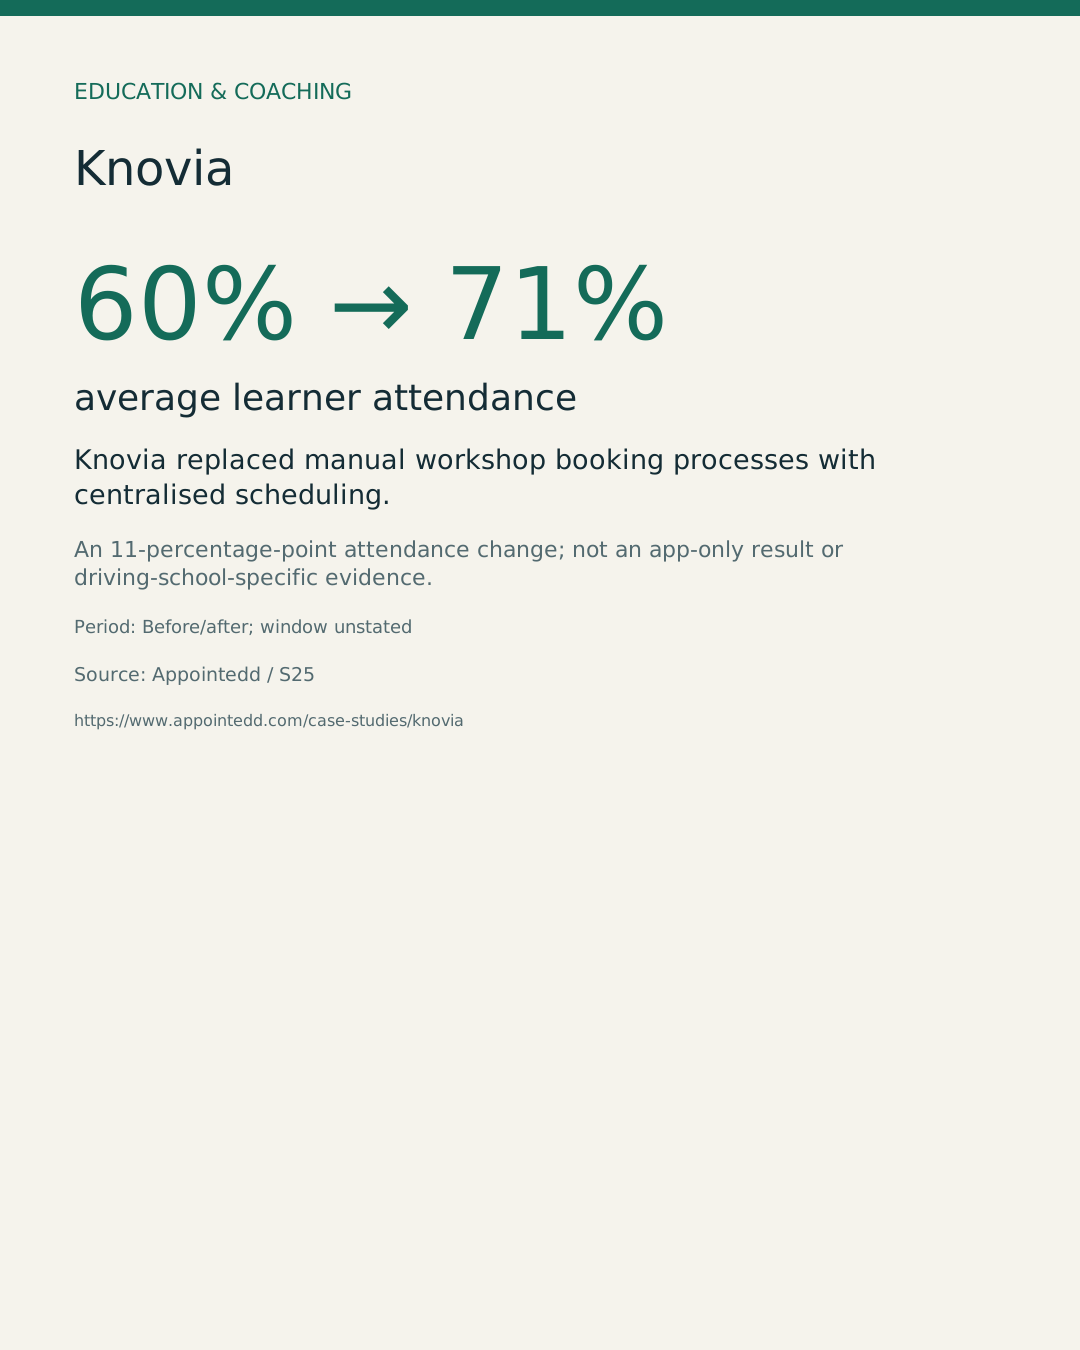
60% → 71% average learner attendance
Source: Appointedd. An 11-percentage-point attendance change; not an app-only result or driving-school-specific evidence.
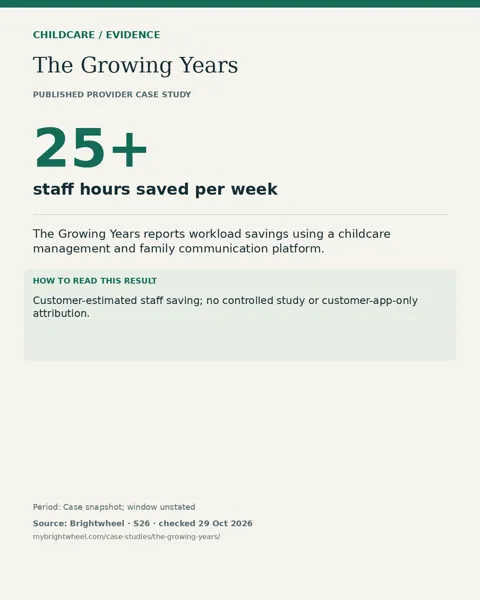
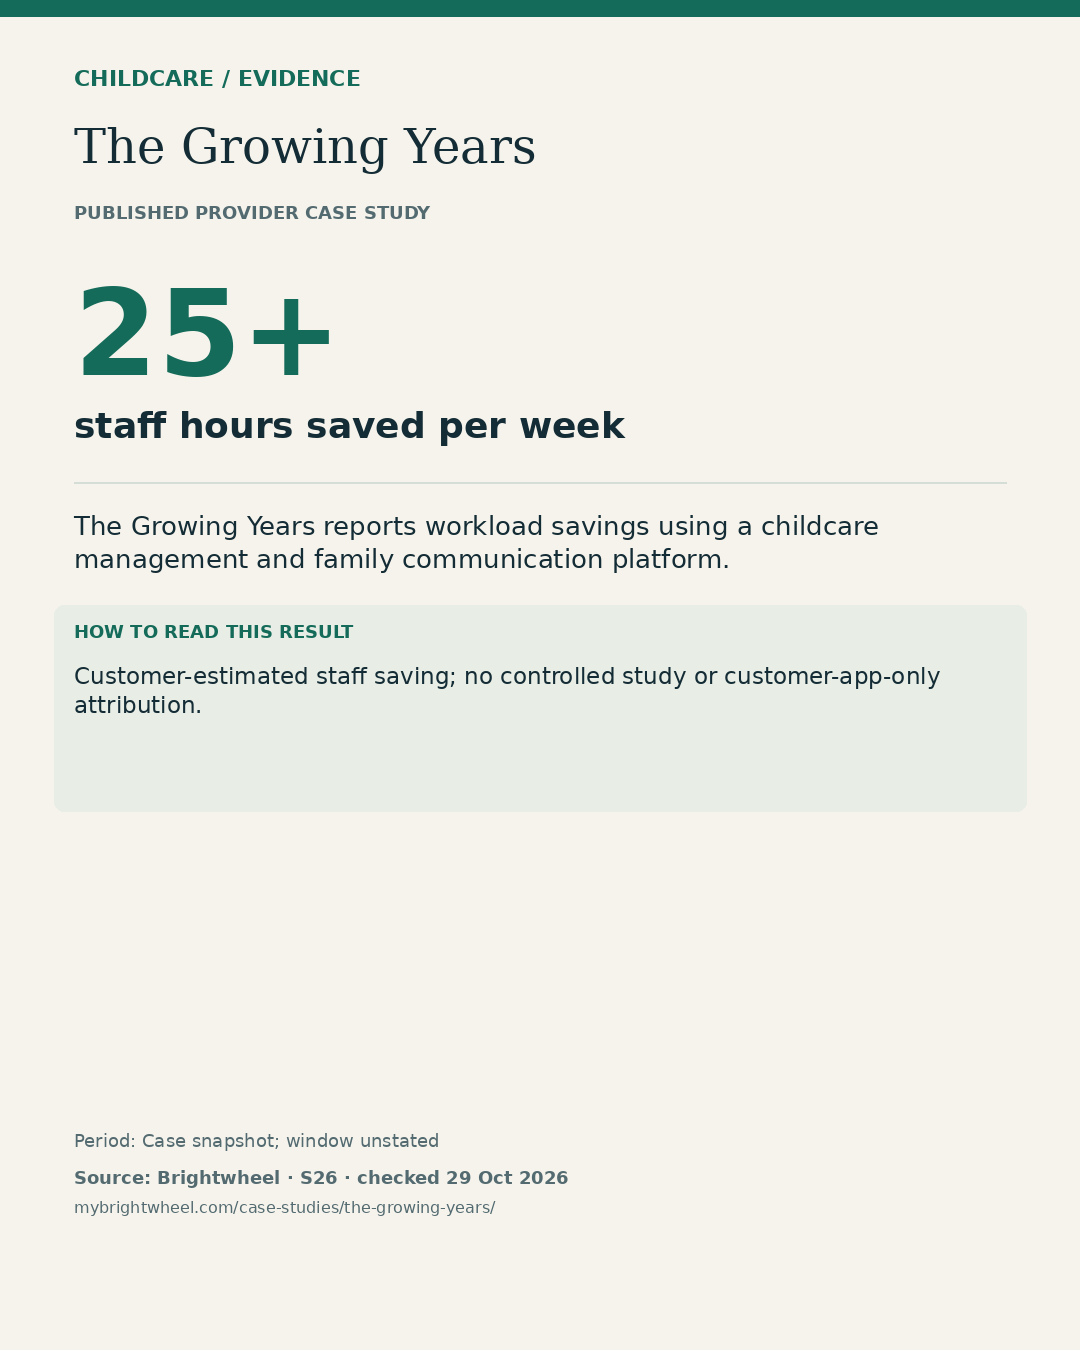
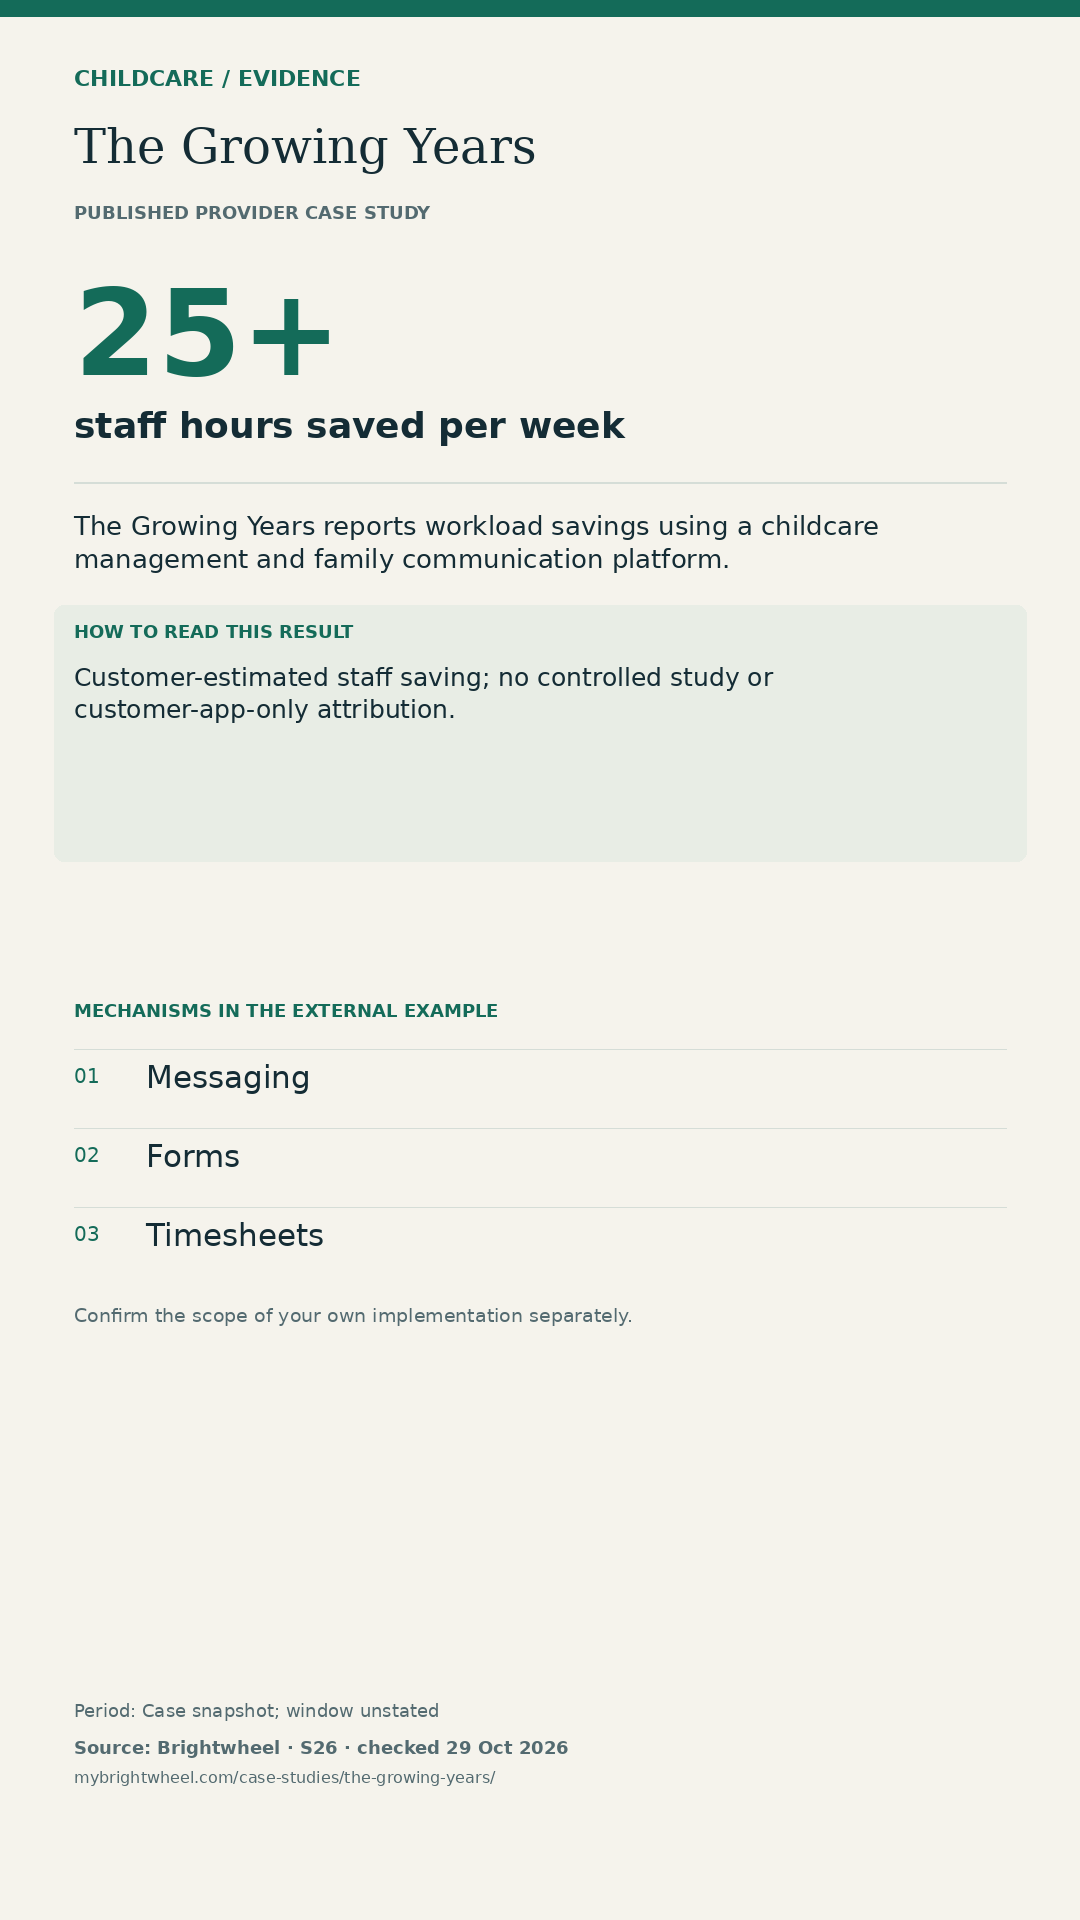
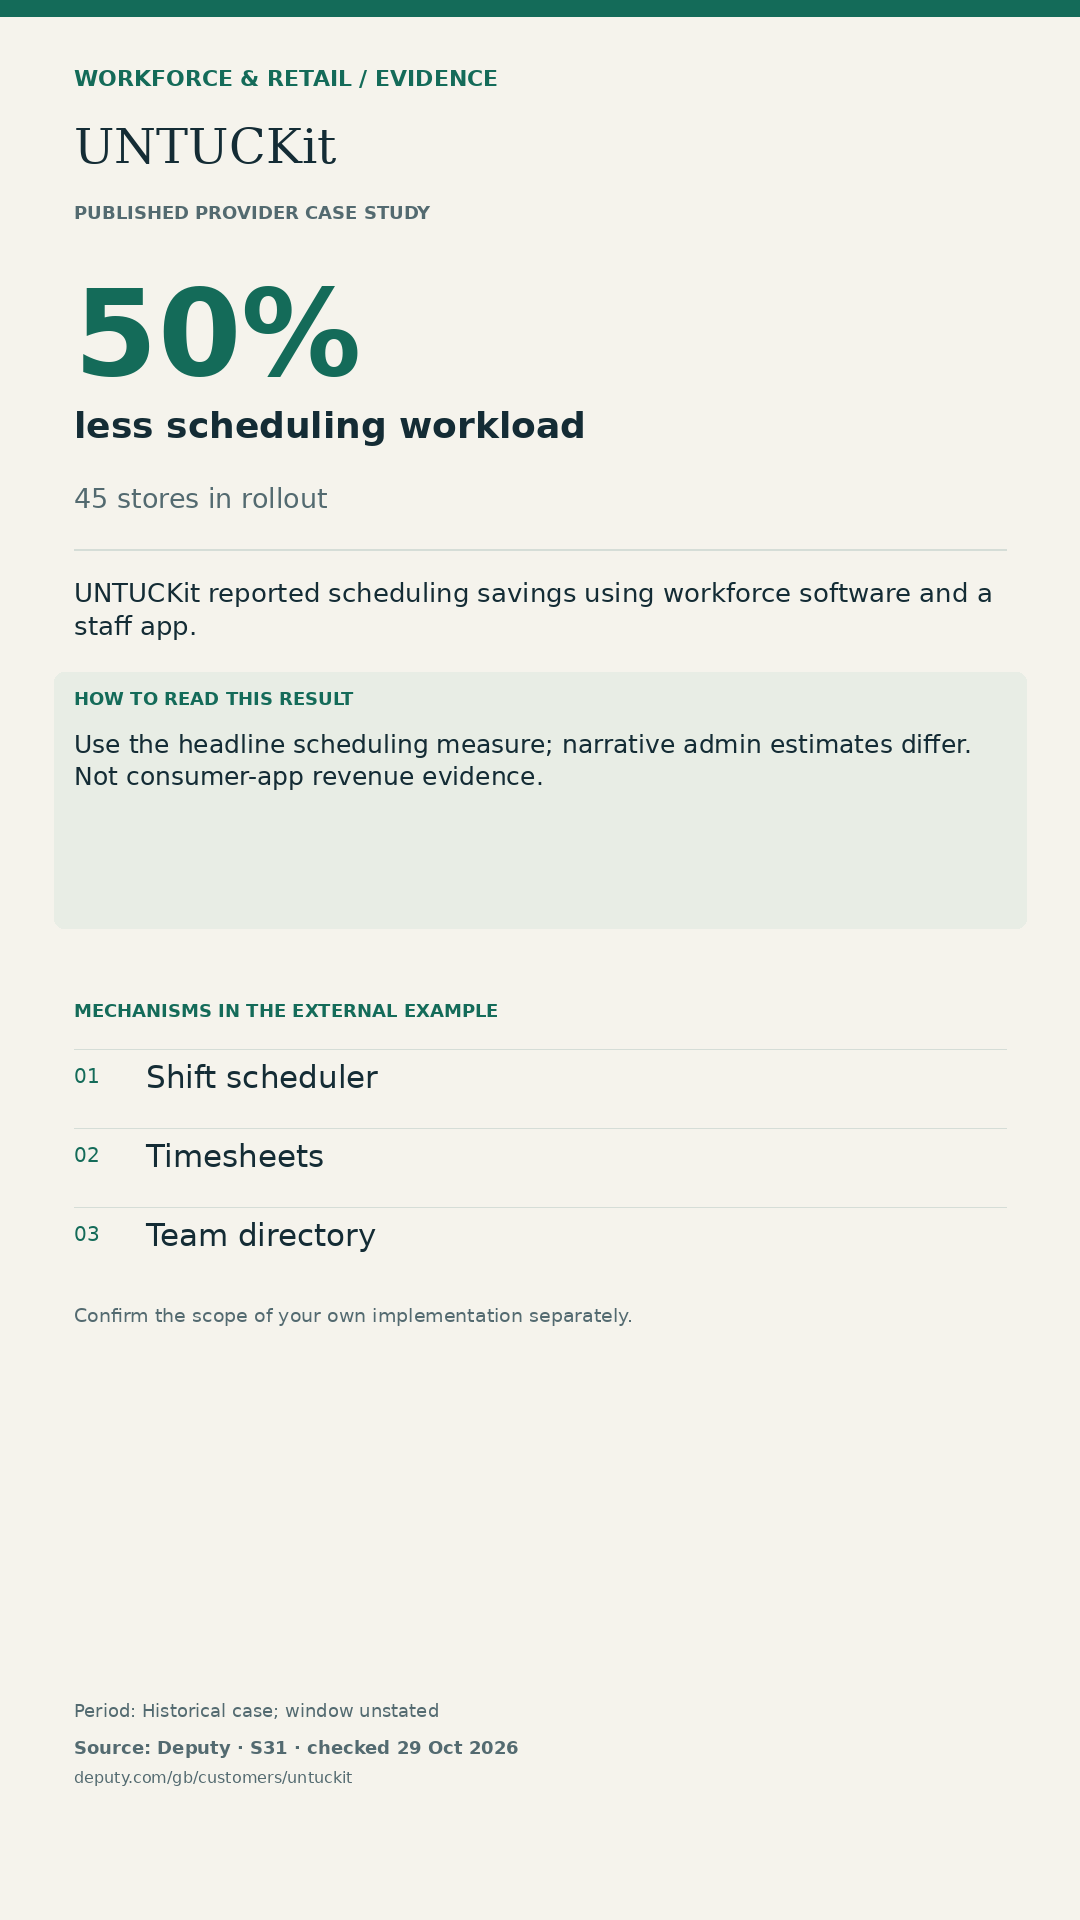
25+ staff hours saved per week
Source: Brightwheel. Customer-estimated staff saving; no controlled study or customer-app-only attribution.
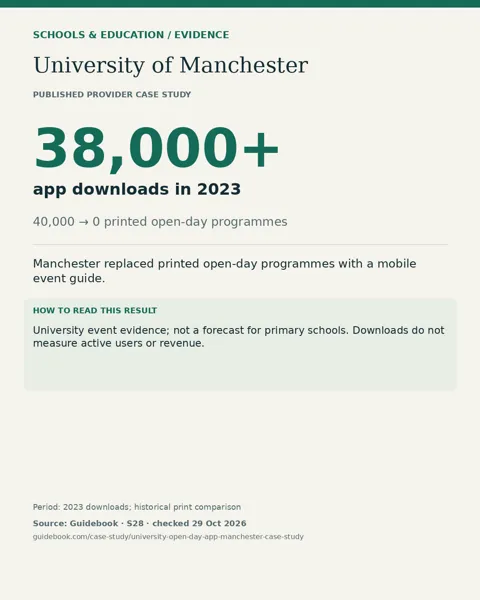
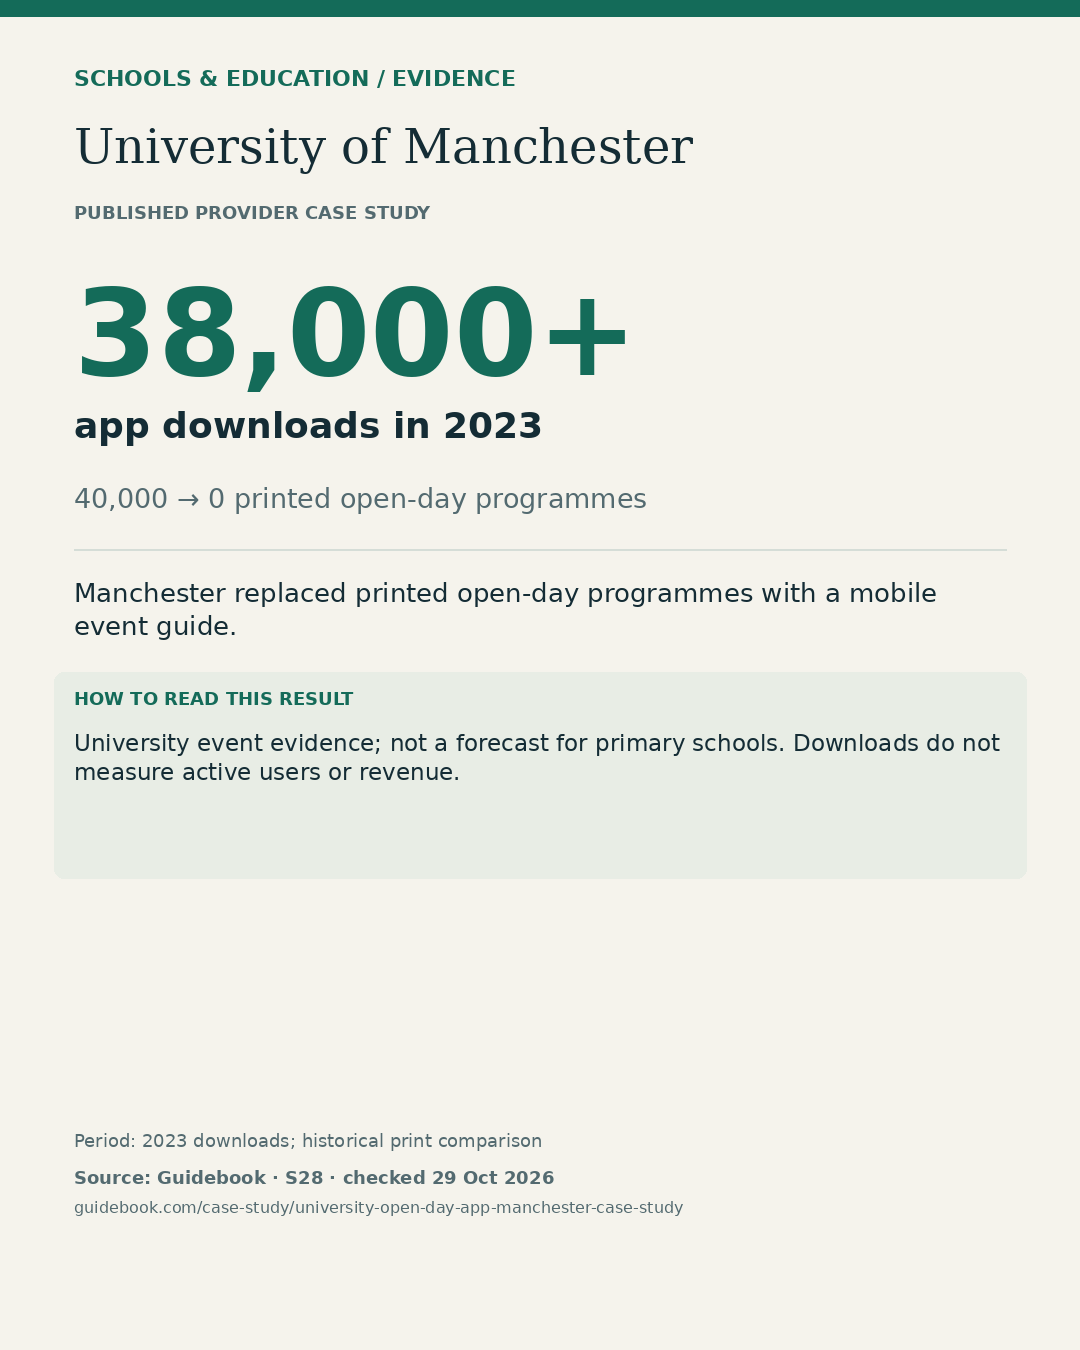
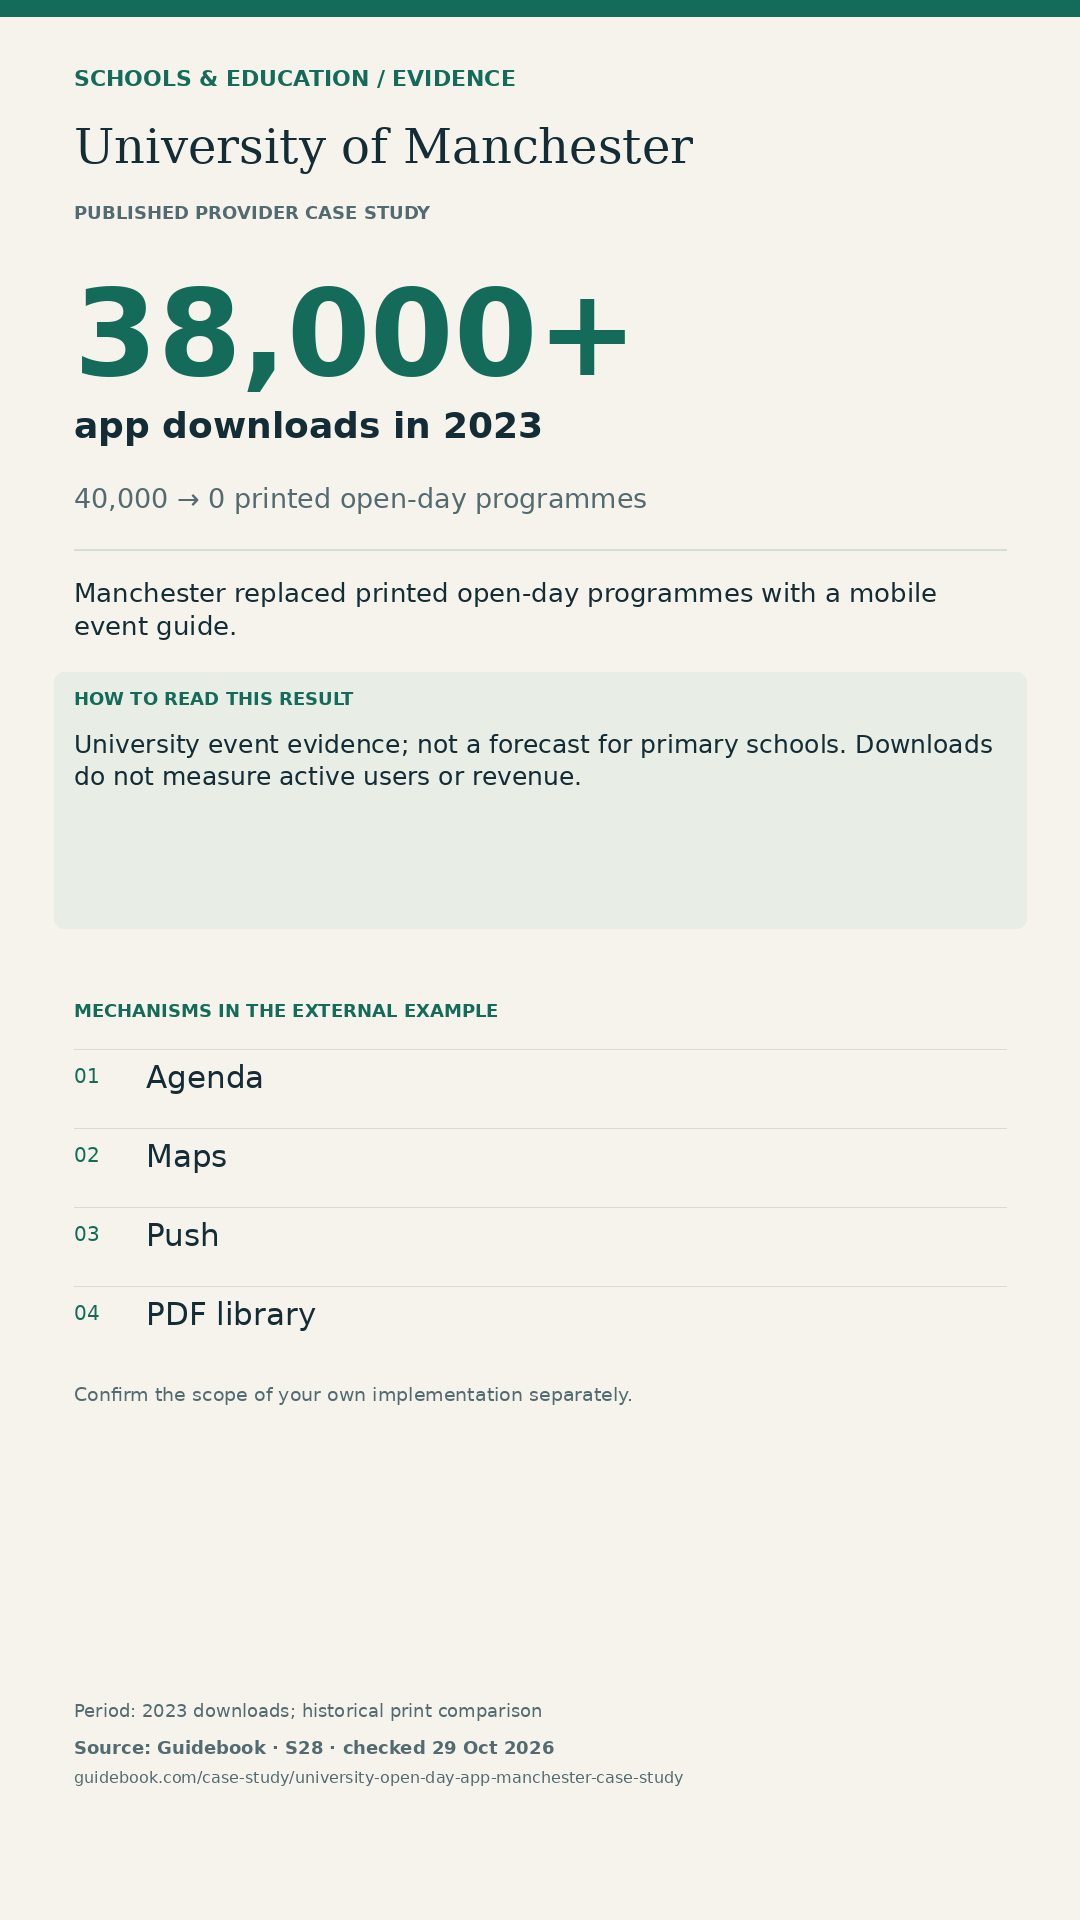
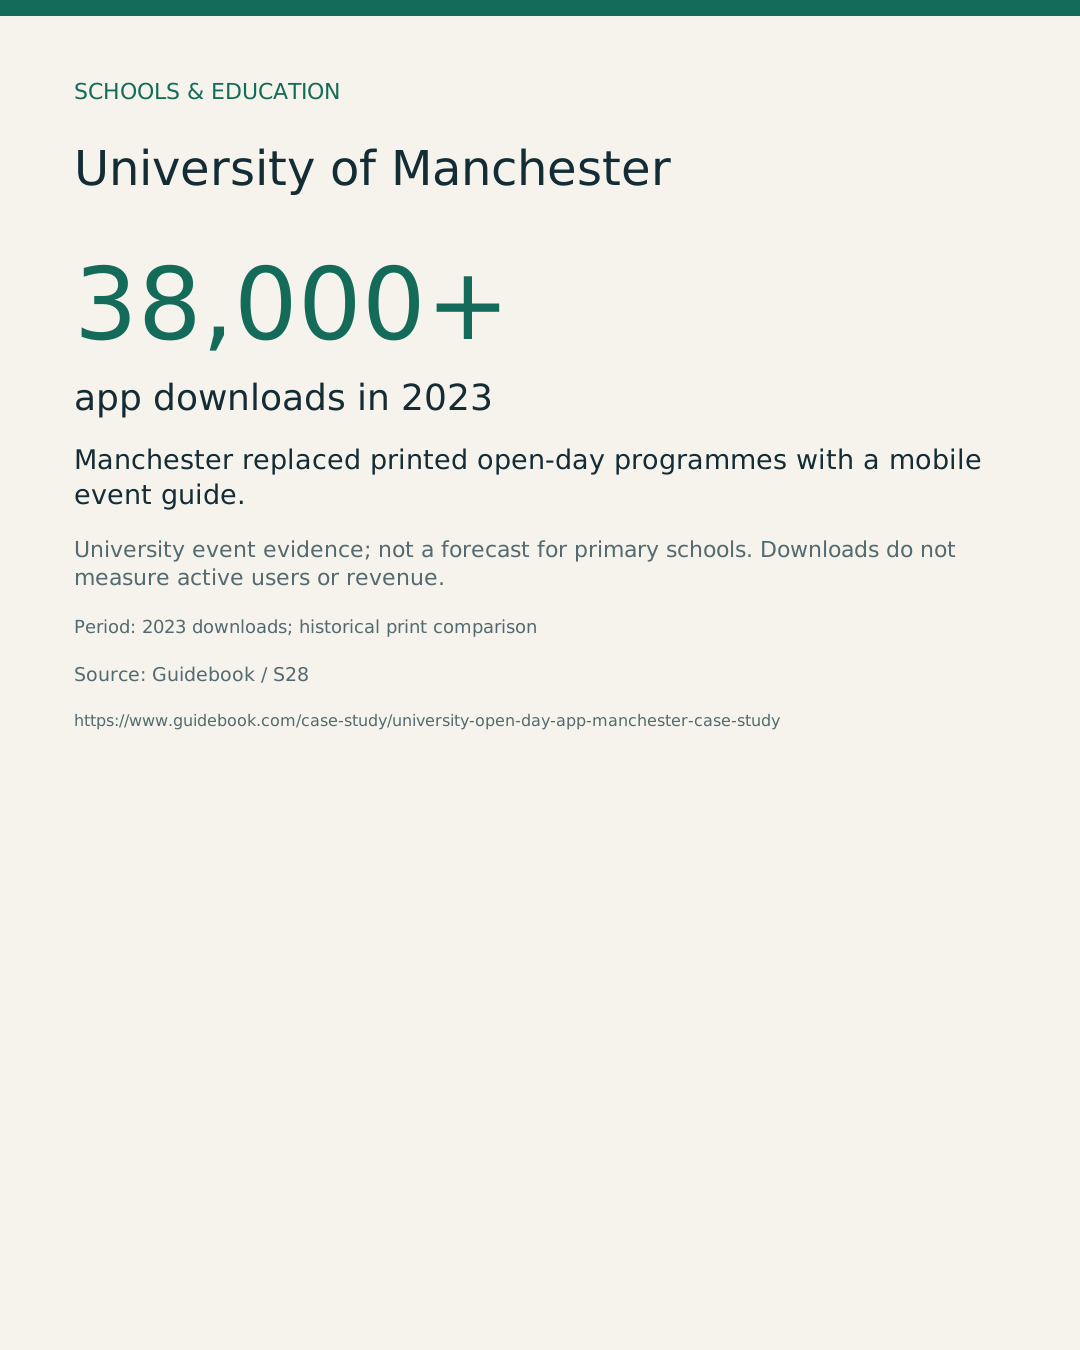
38,000+ app downloads in 2023
Source: Guidebook. University event evidence; not a forecast for primary schools. Downloads do not measure active users or revenue.
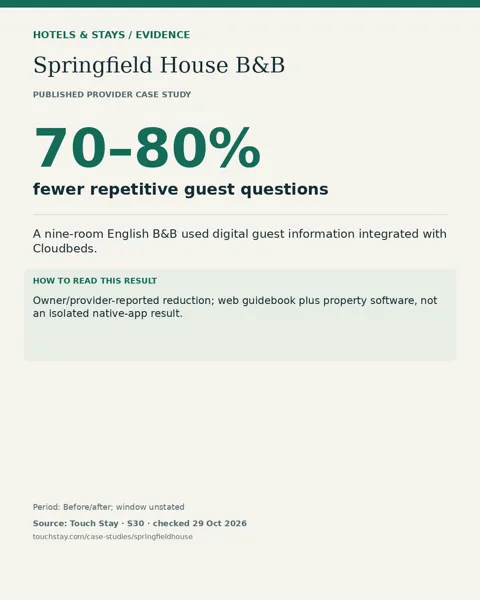
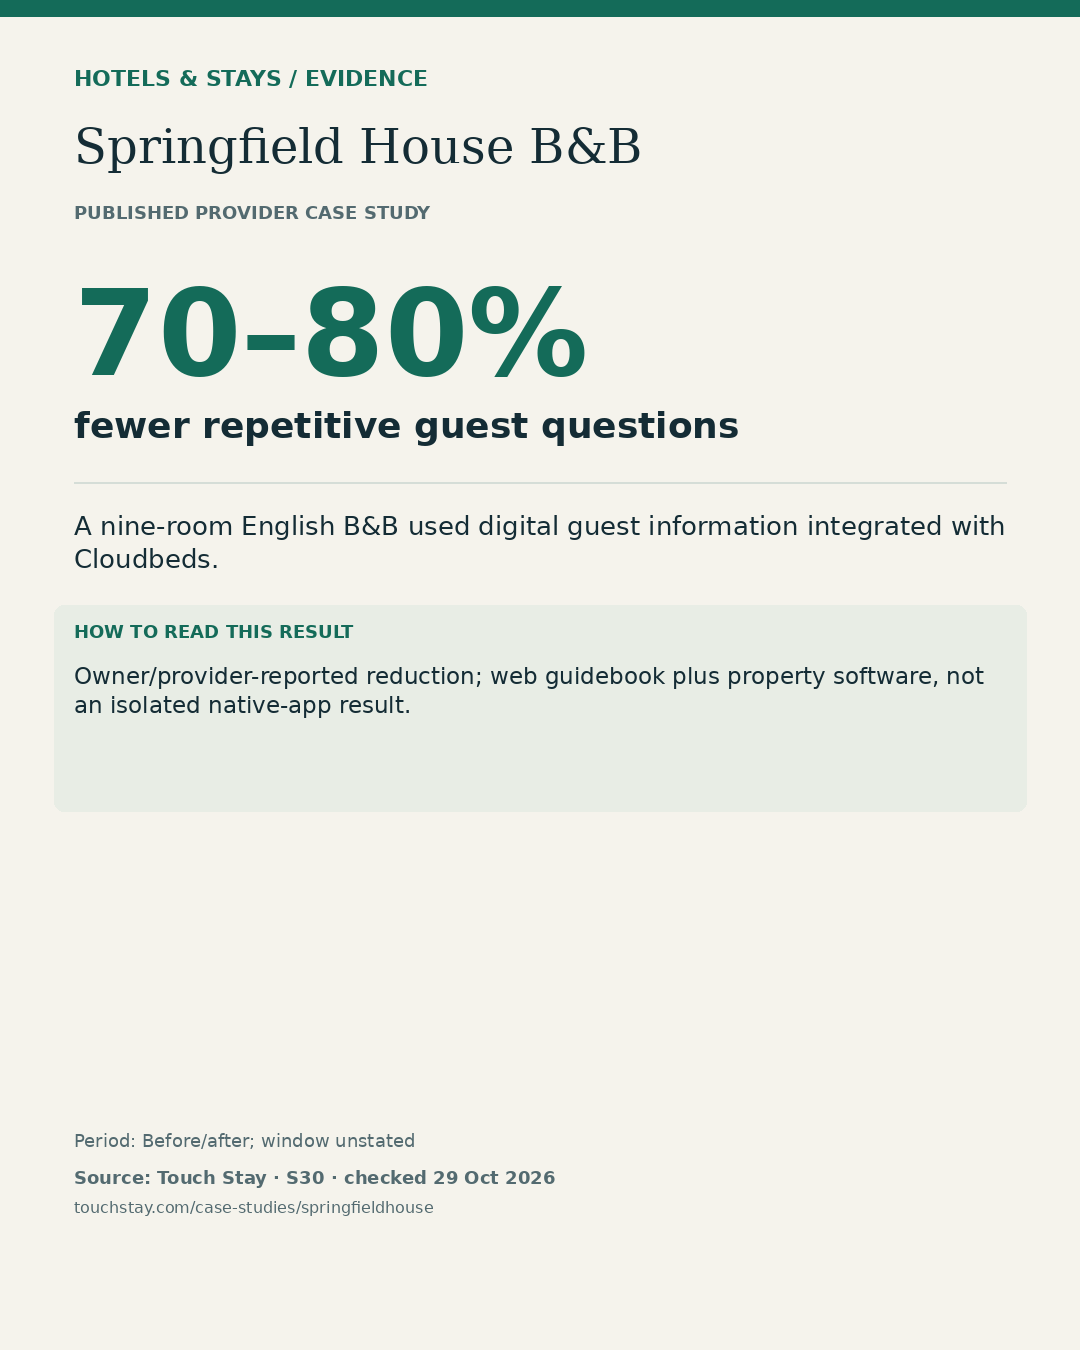
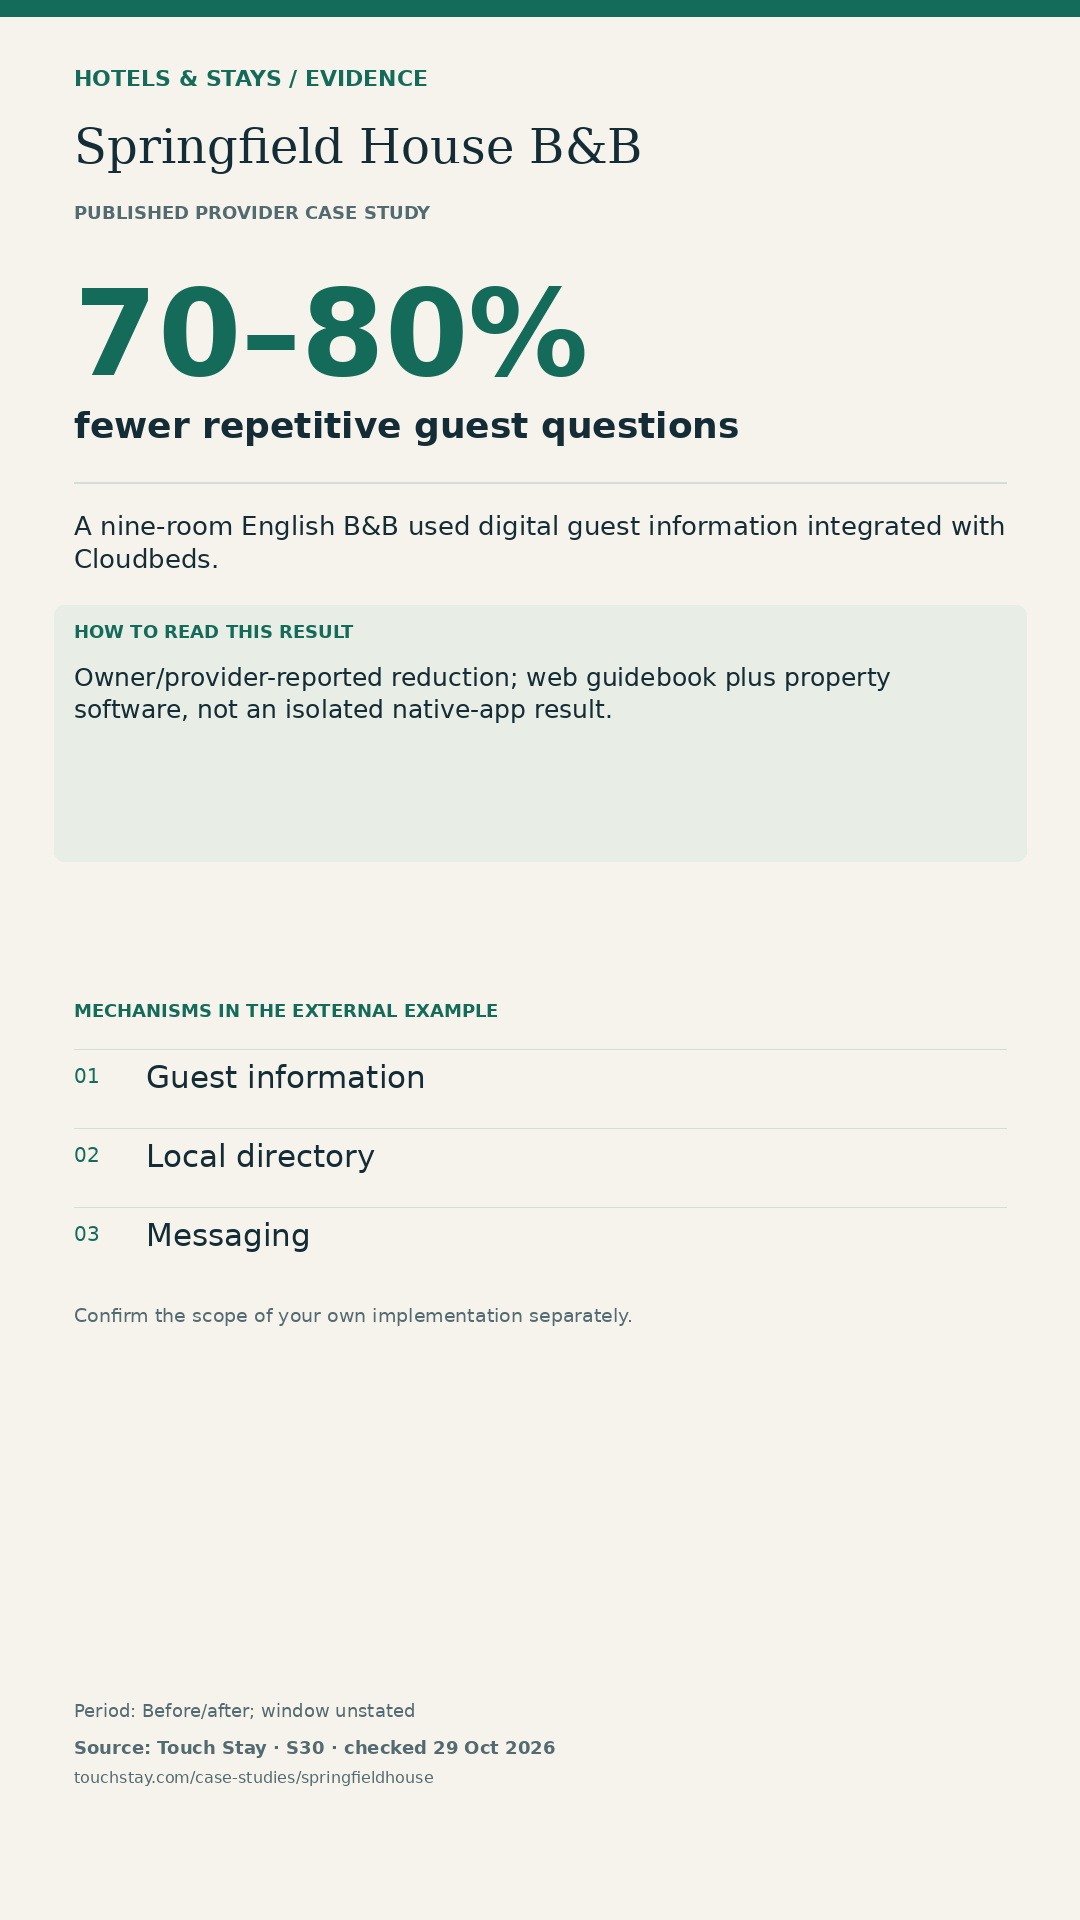
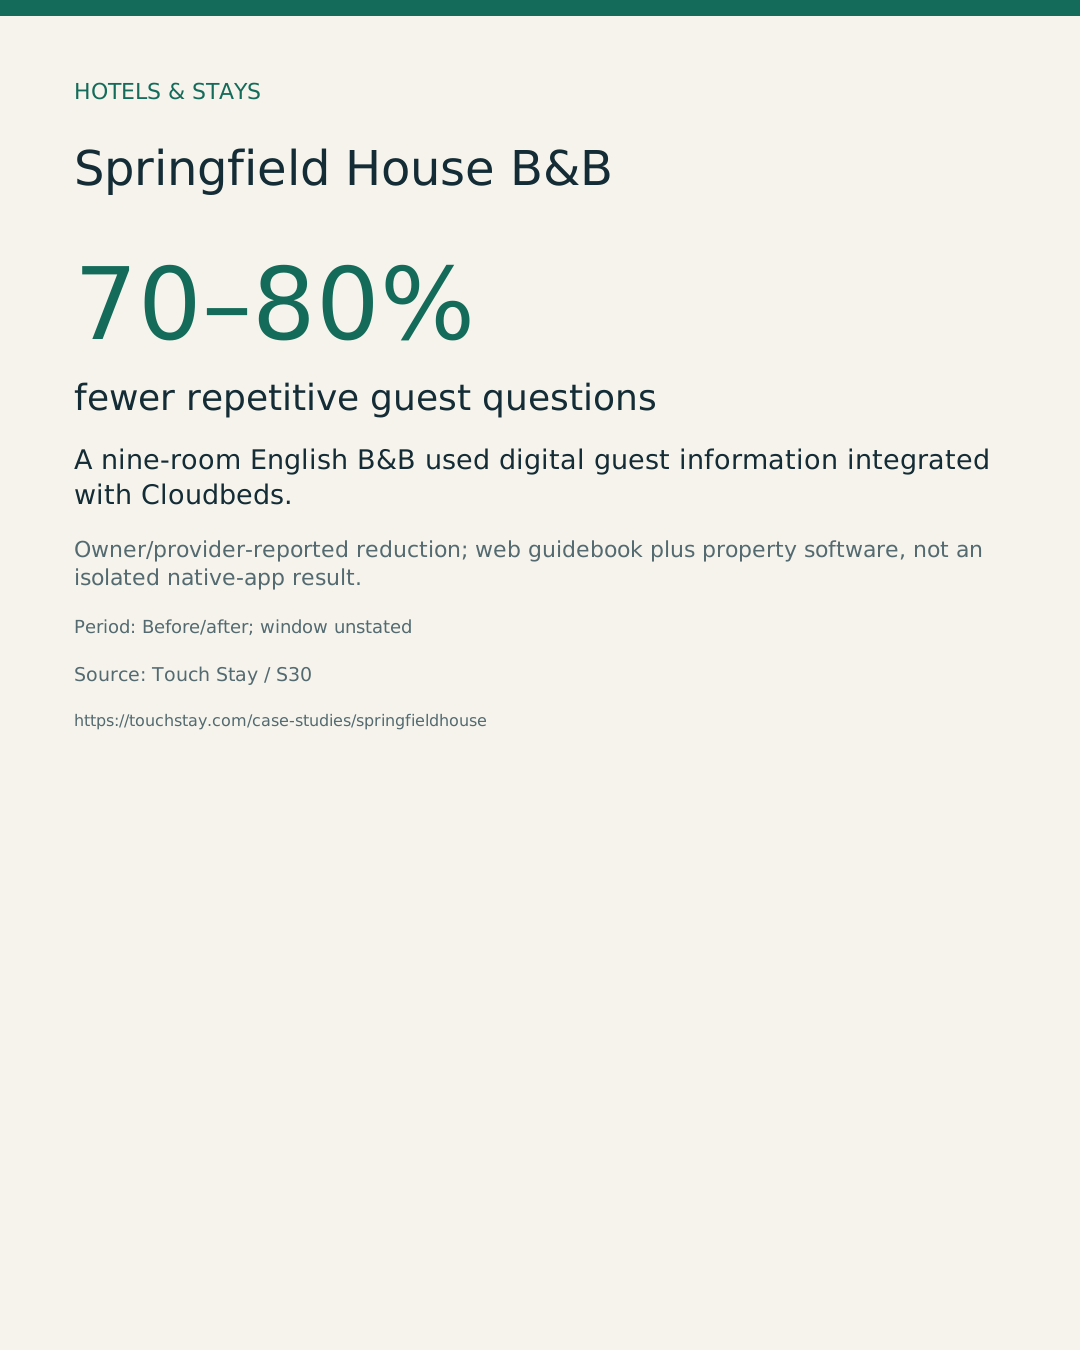
70–80% fewer repetitive guest questions
Source: Touch Stay. Owner/provider-reported reduction; web guidebook plus property software, not an isolated native-app result.
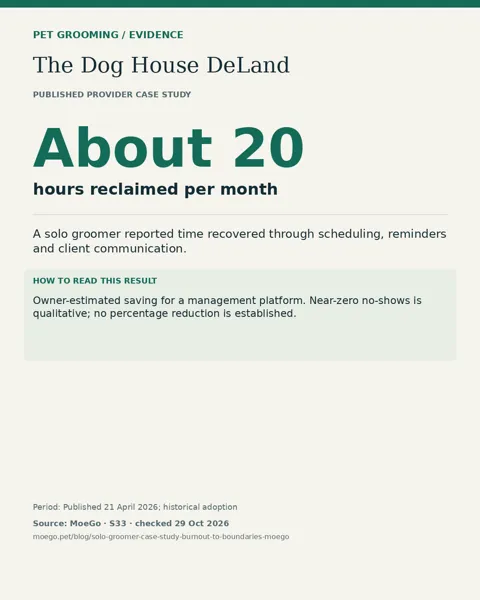
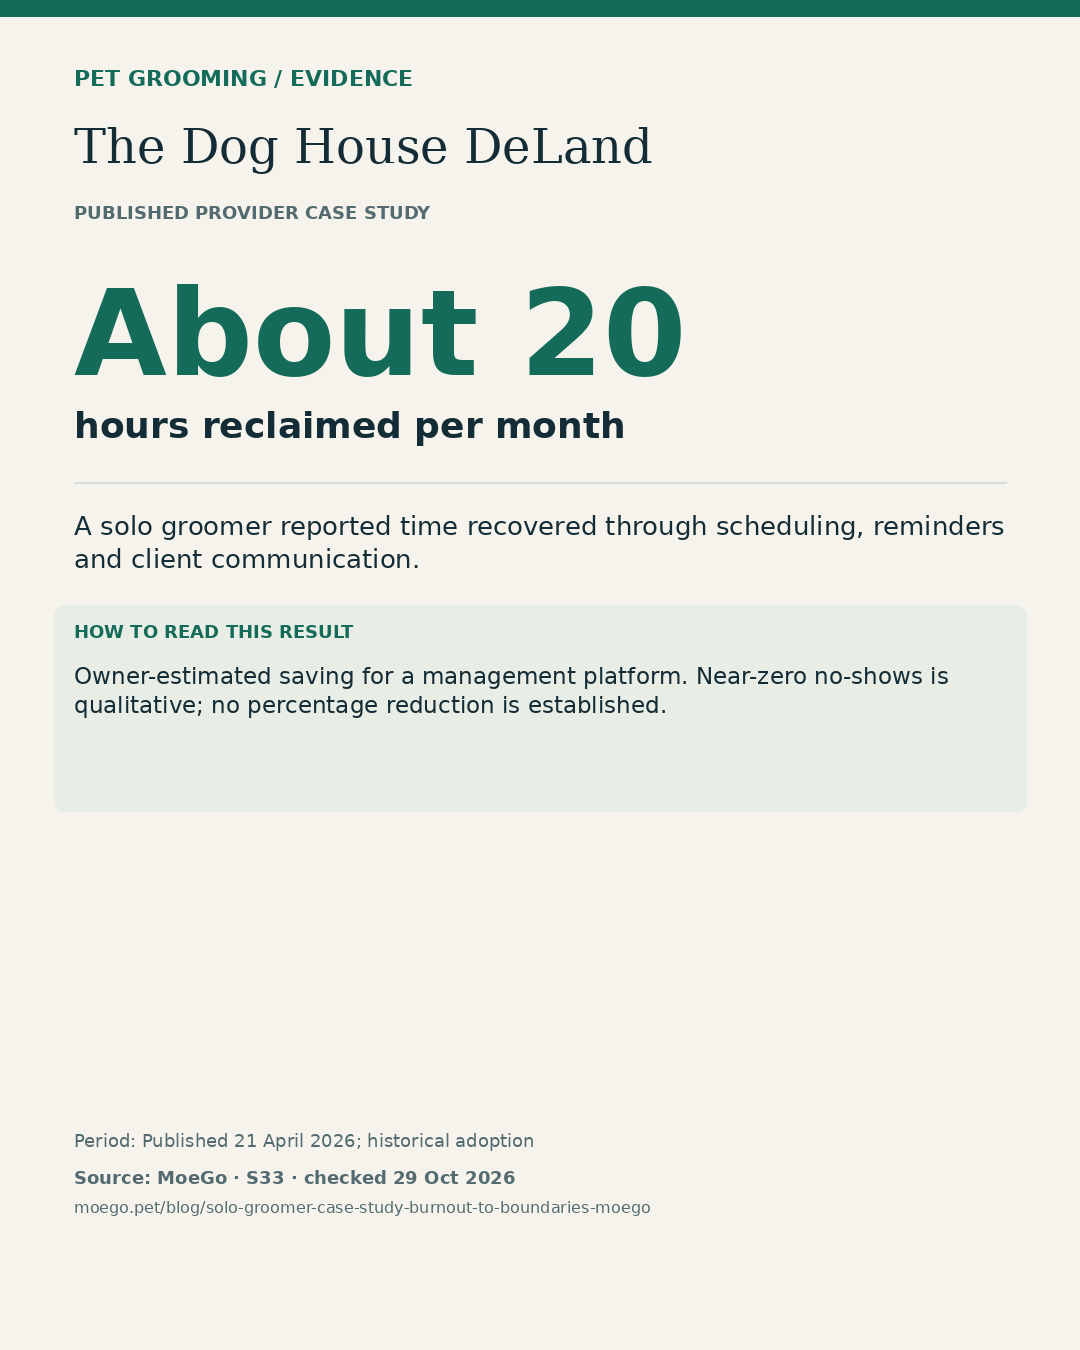
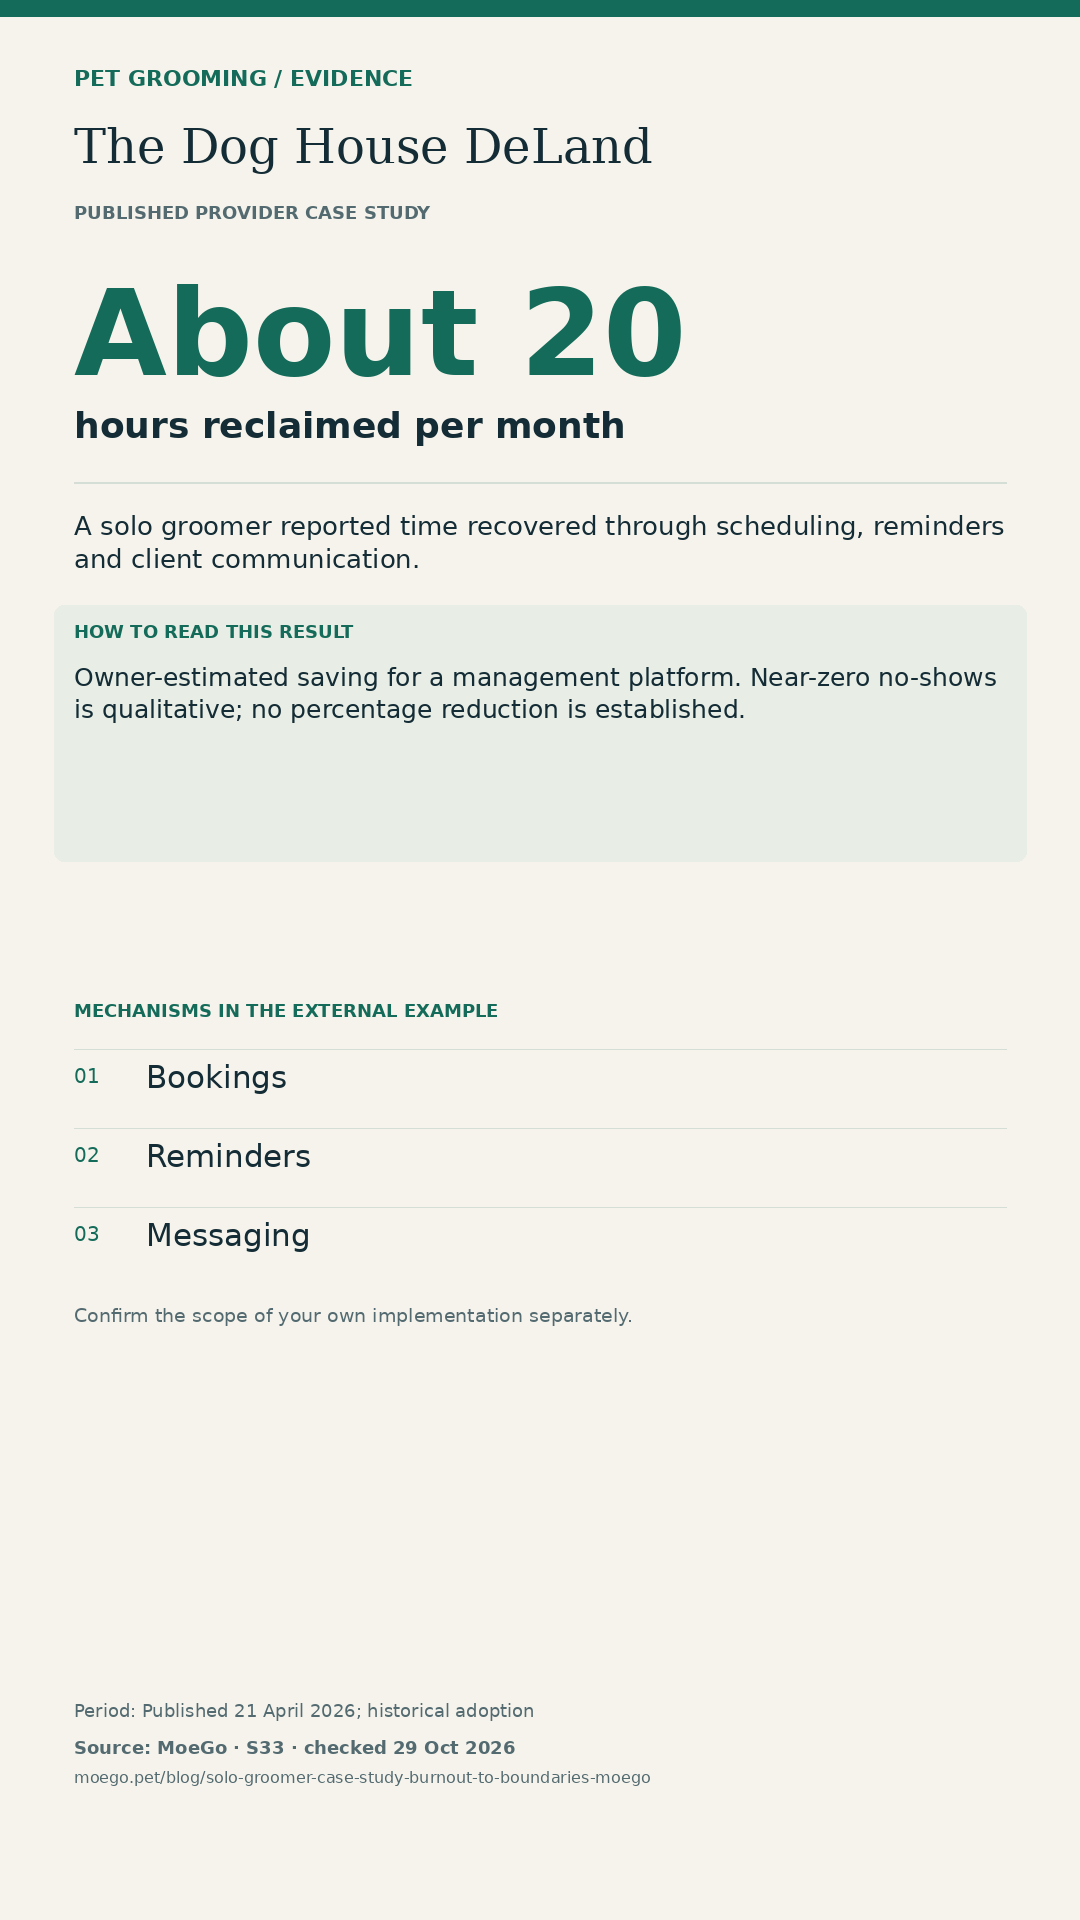
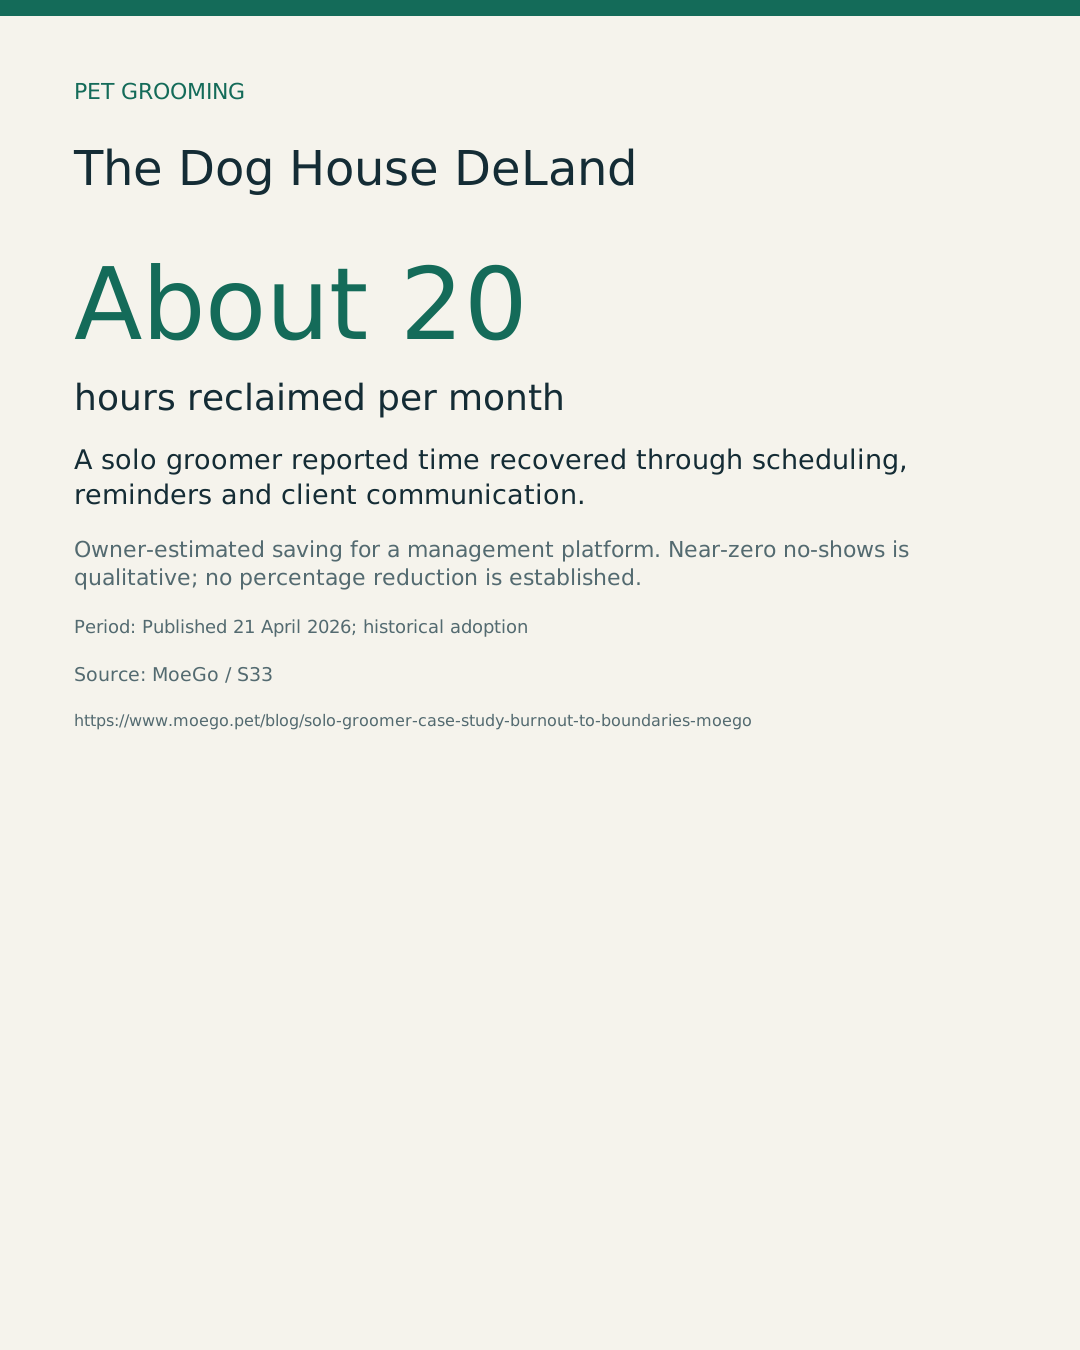
About 20 hours reclaimed per month
Source: MoeGo. Owner-estimated saving for a management platform. Near-zero no-shows is qualitative; no percentage reduction is established.
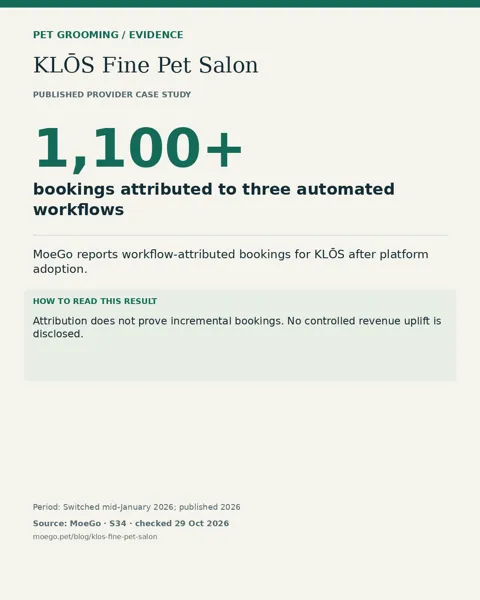
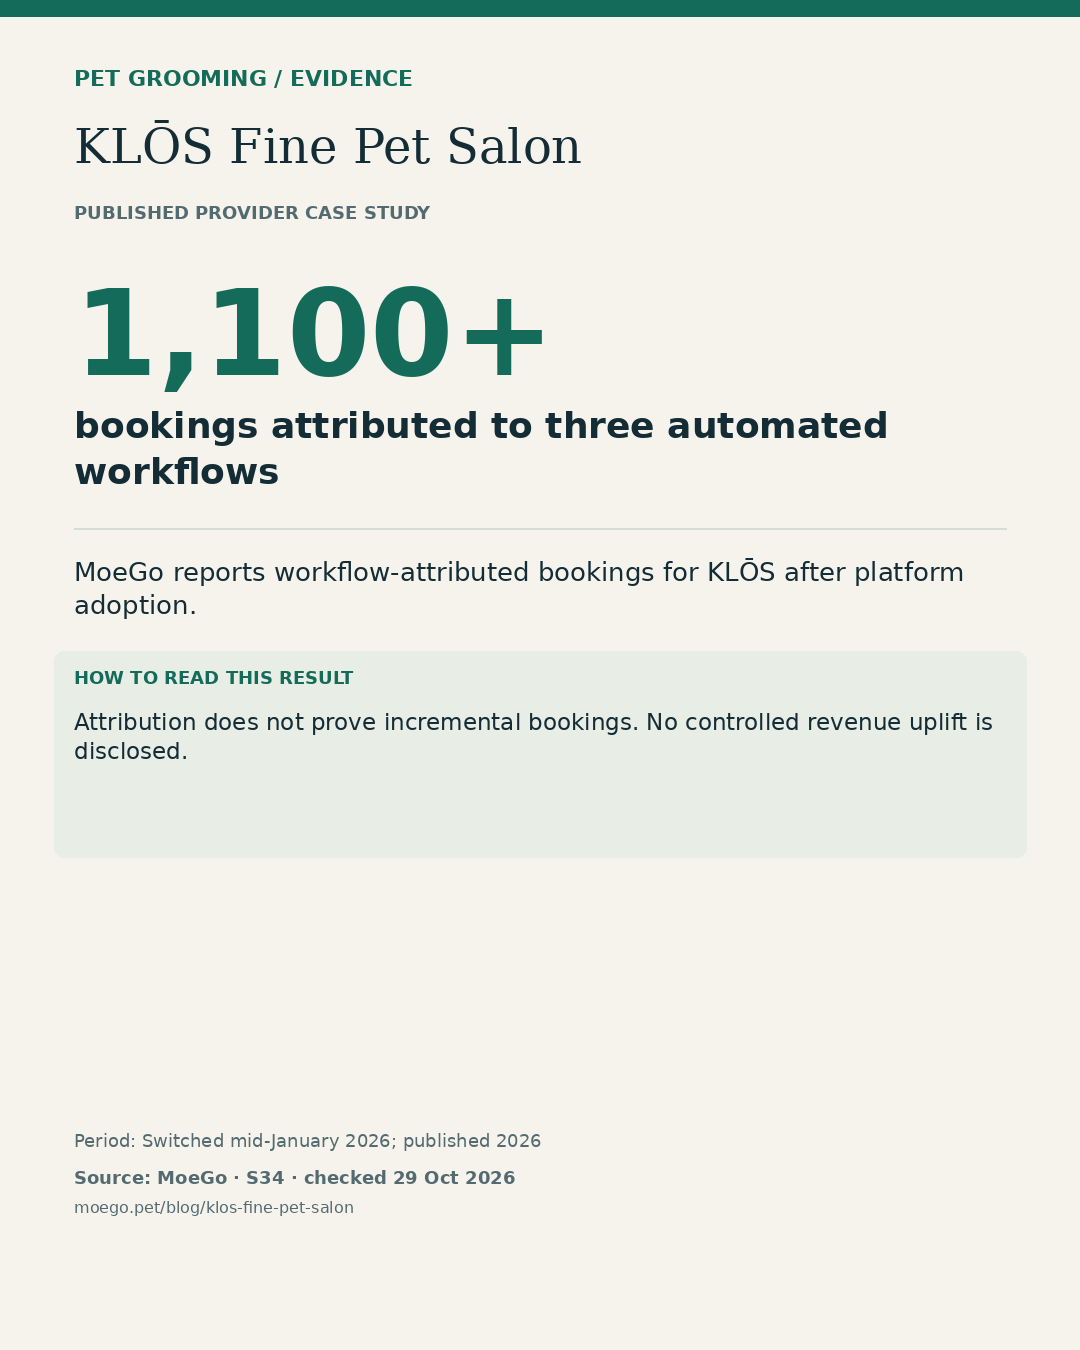
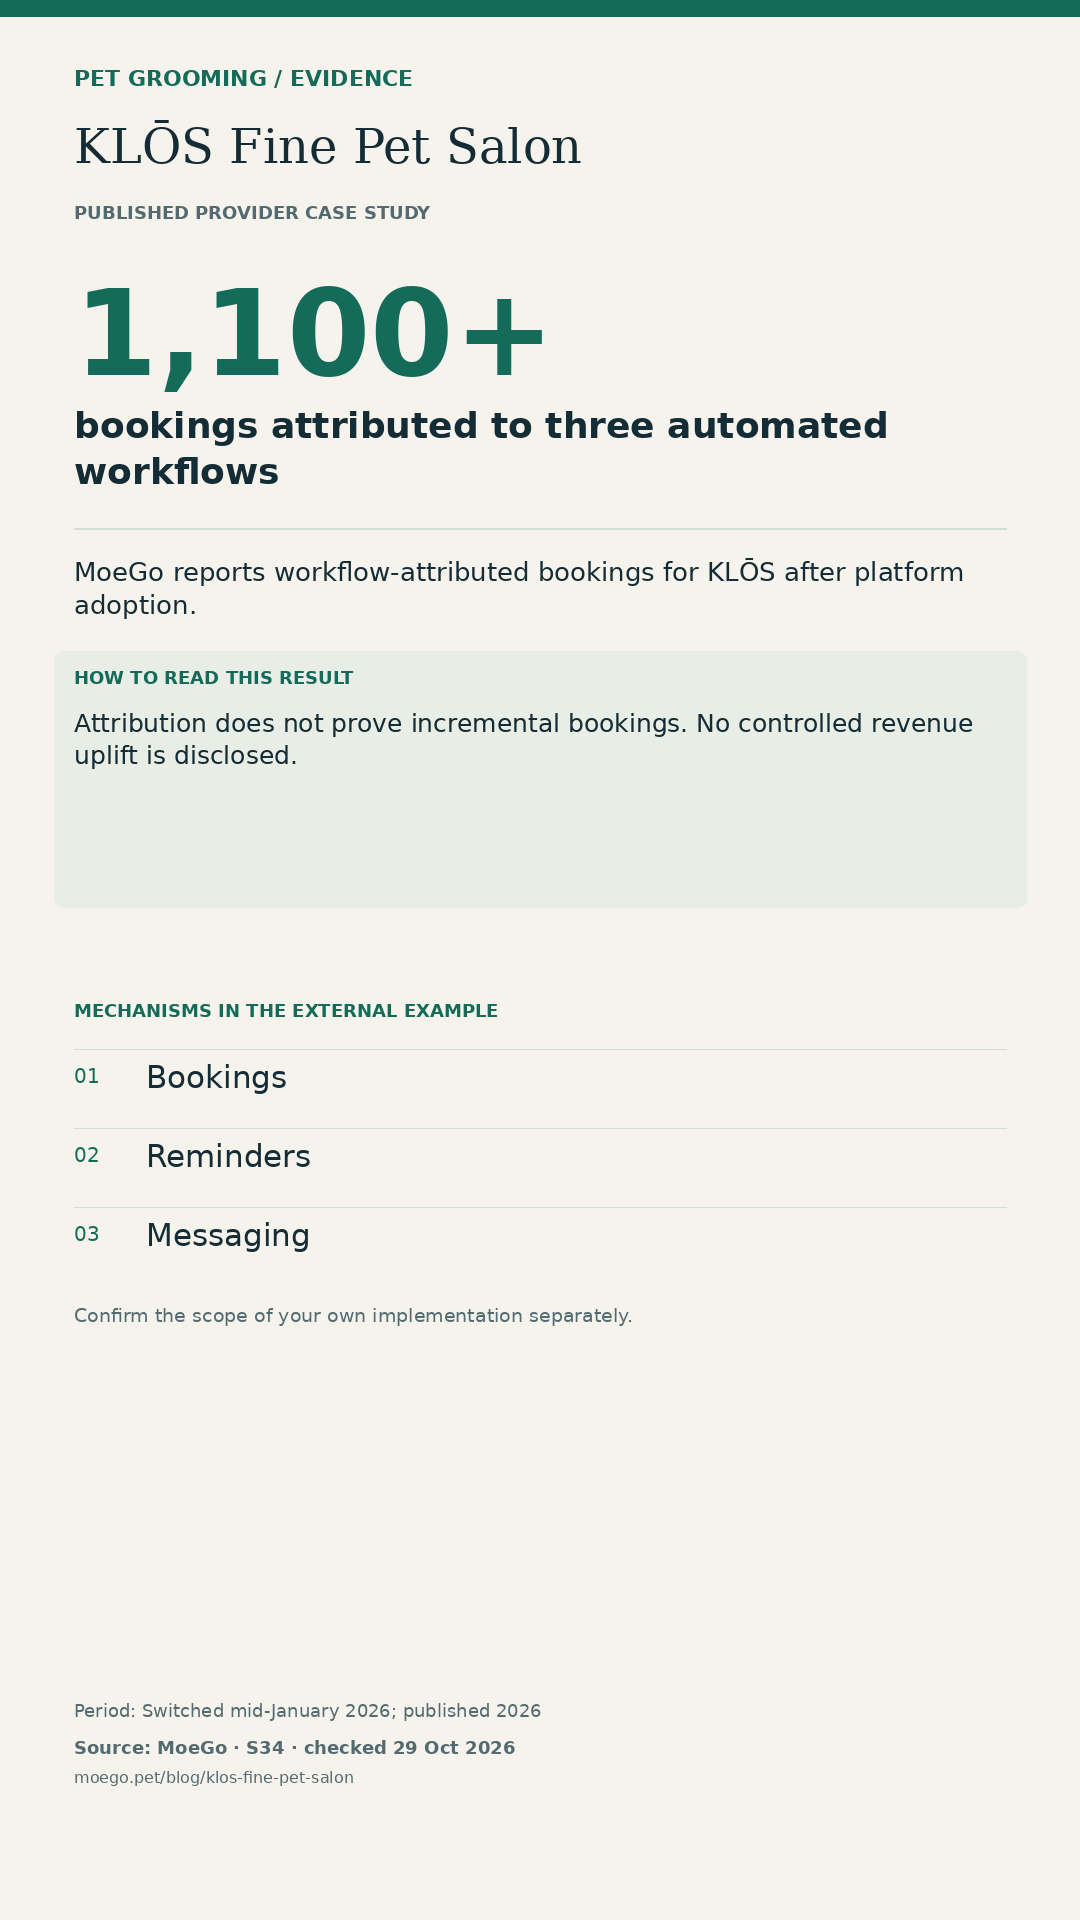
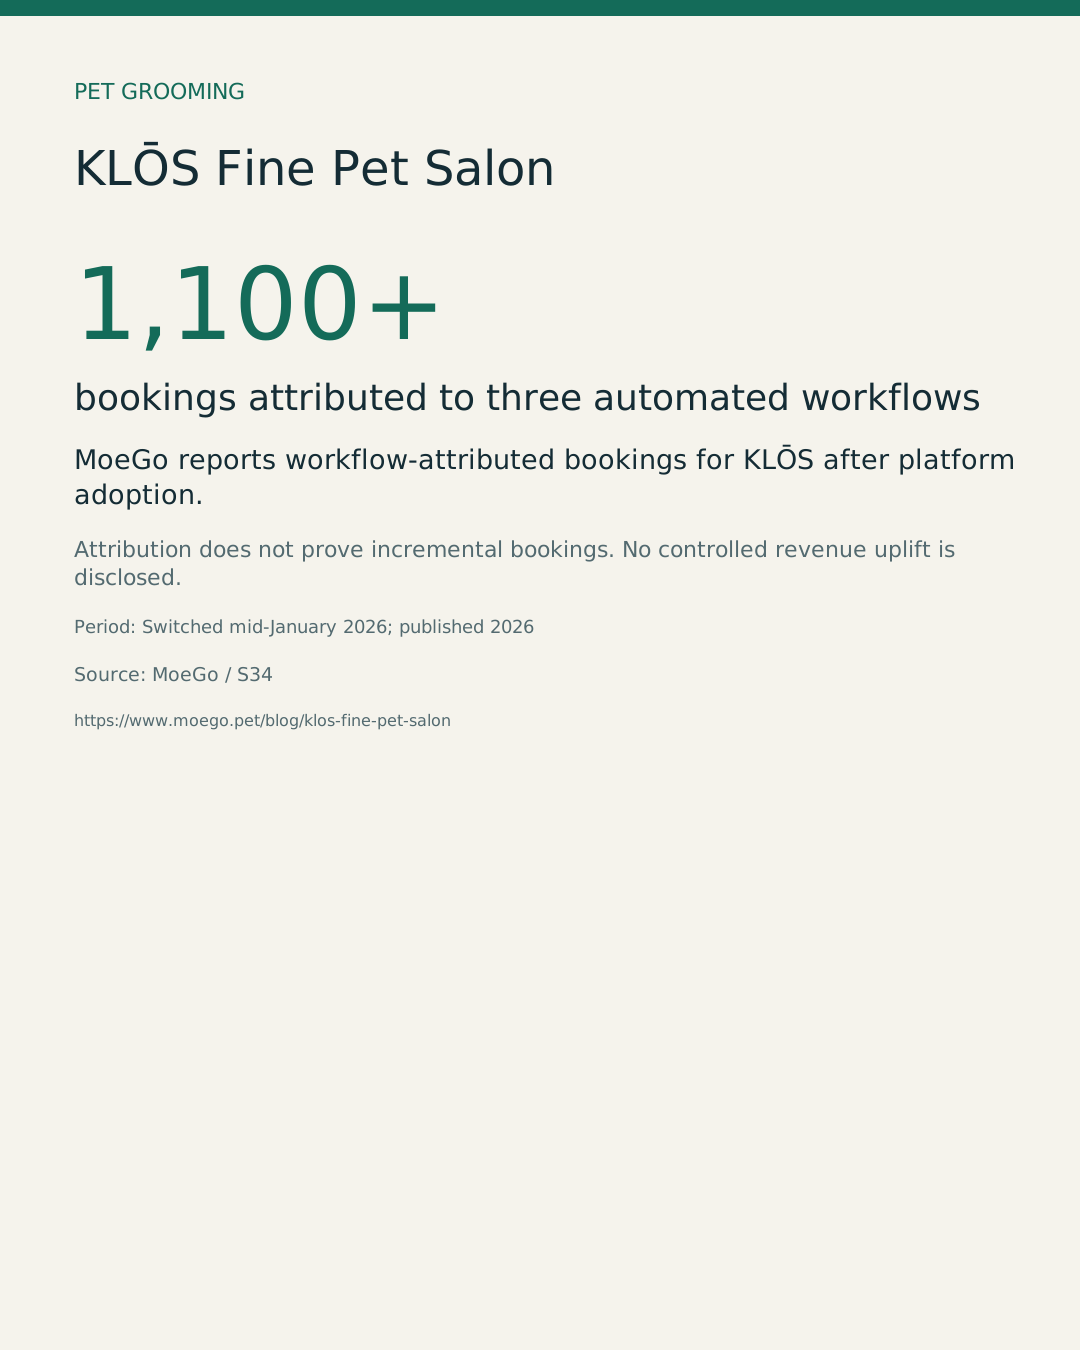
1,100+ bookings attributed to three automated workflows
Source: MoeGo. Attribution does not prove incremental bookings. No controlled revenue uplift is disclosed.
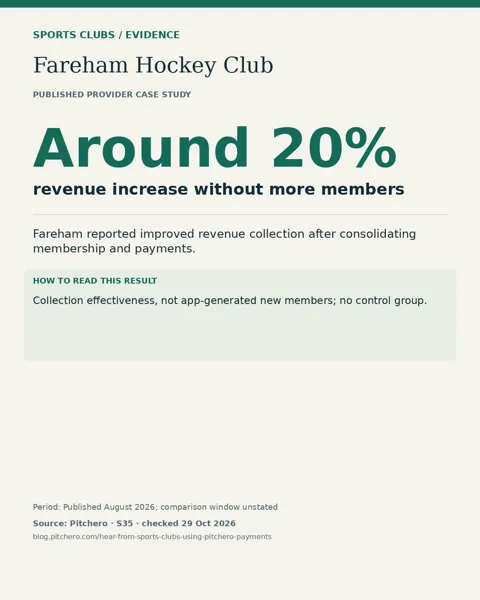
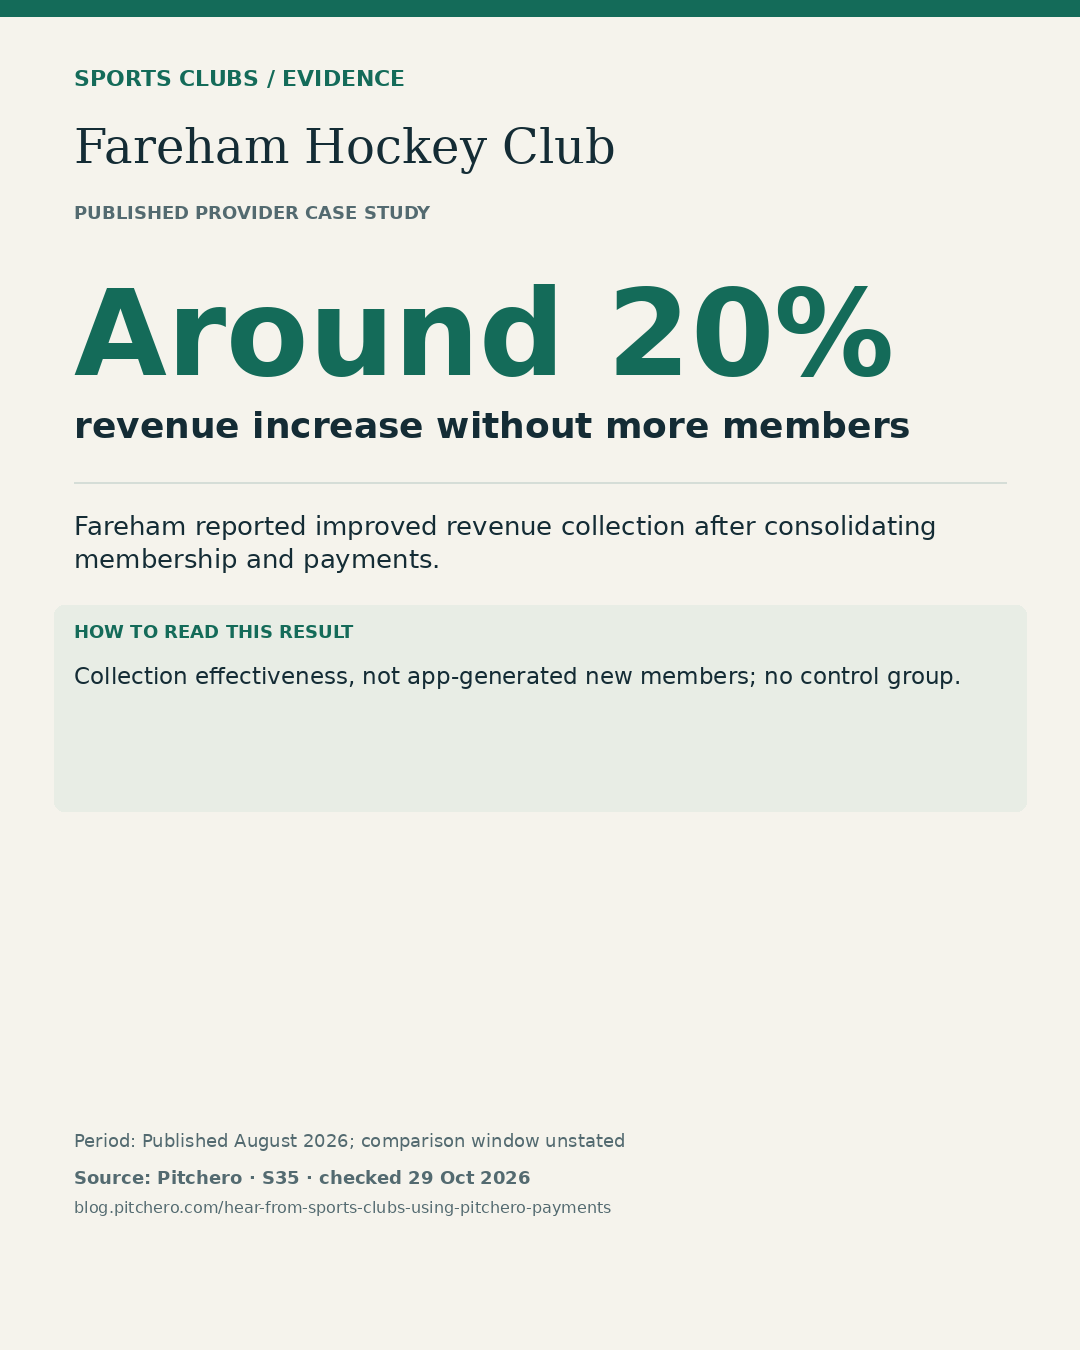
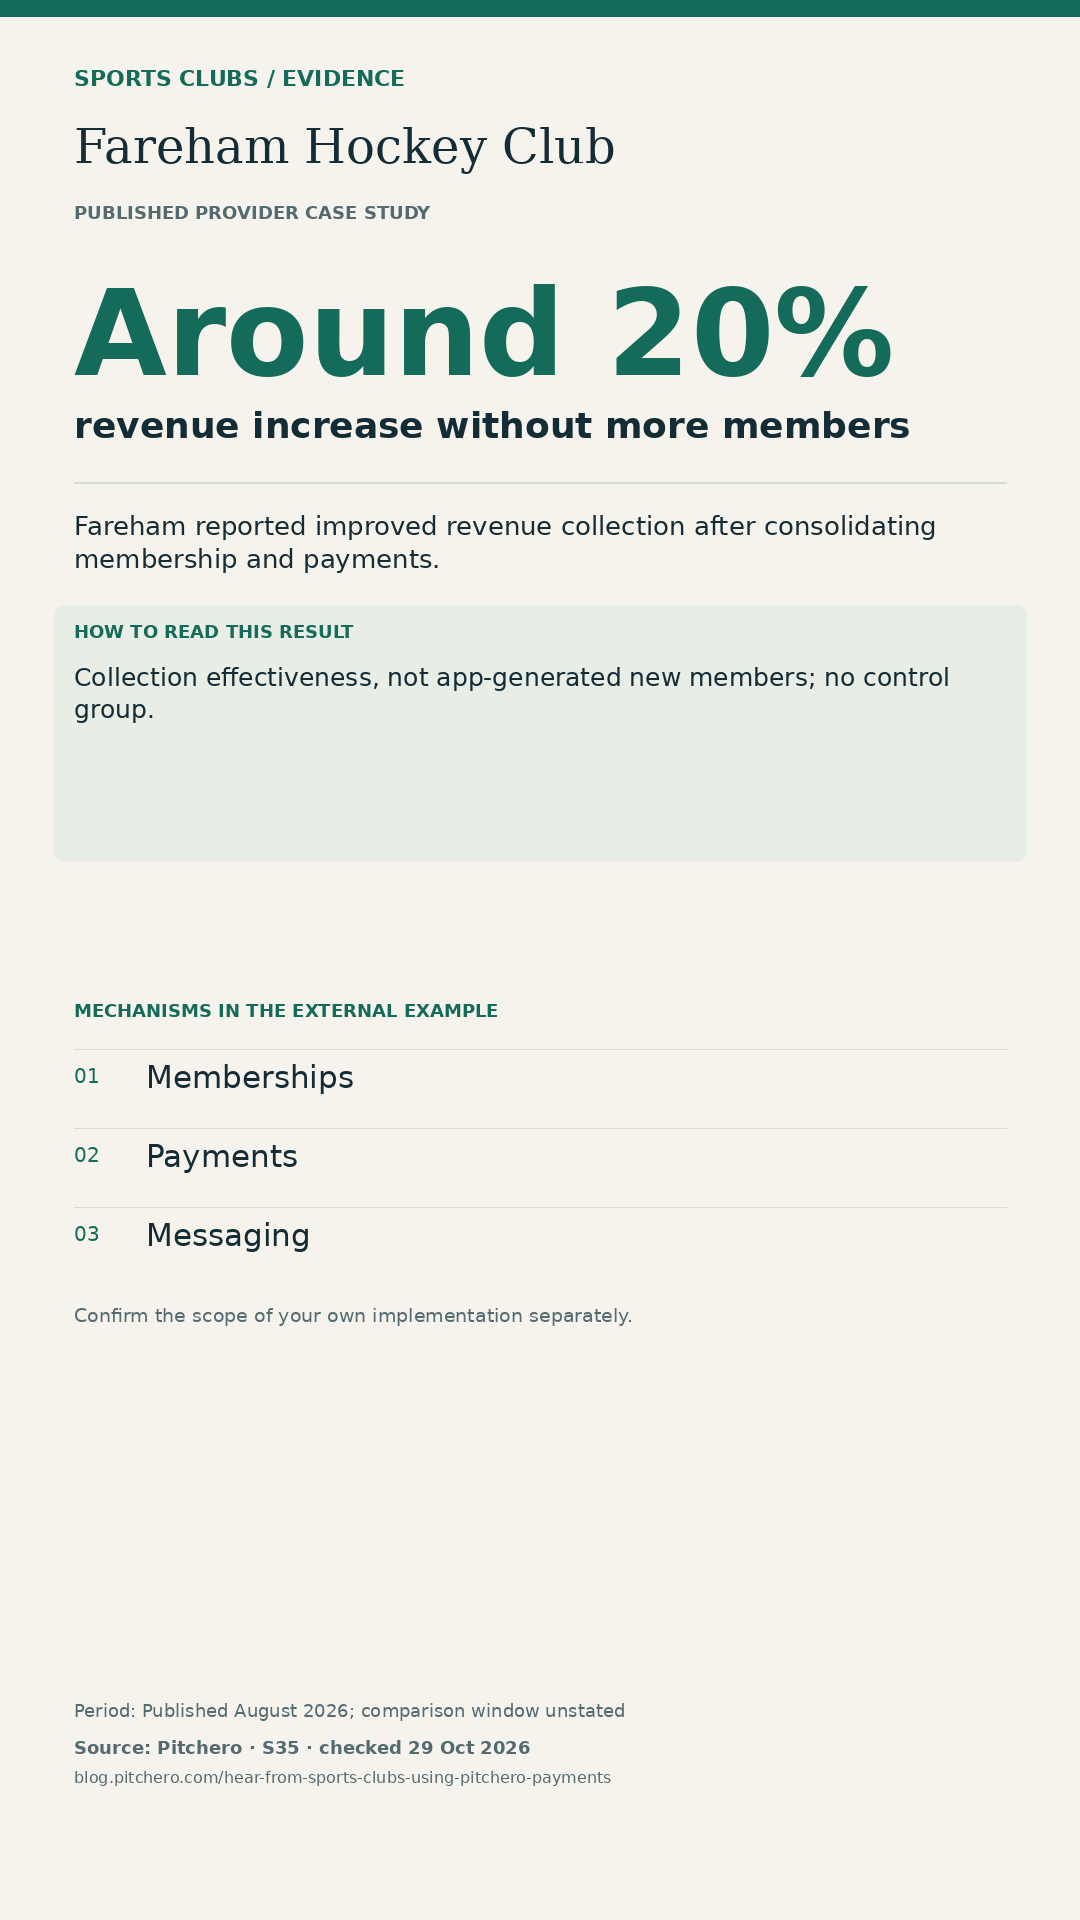
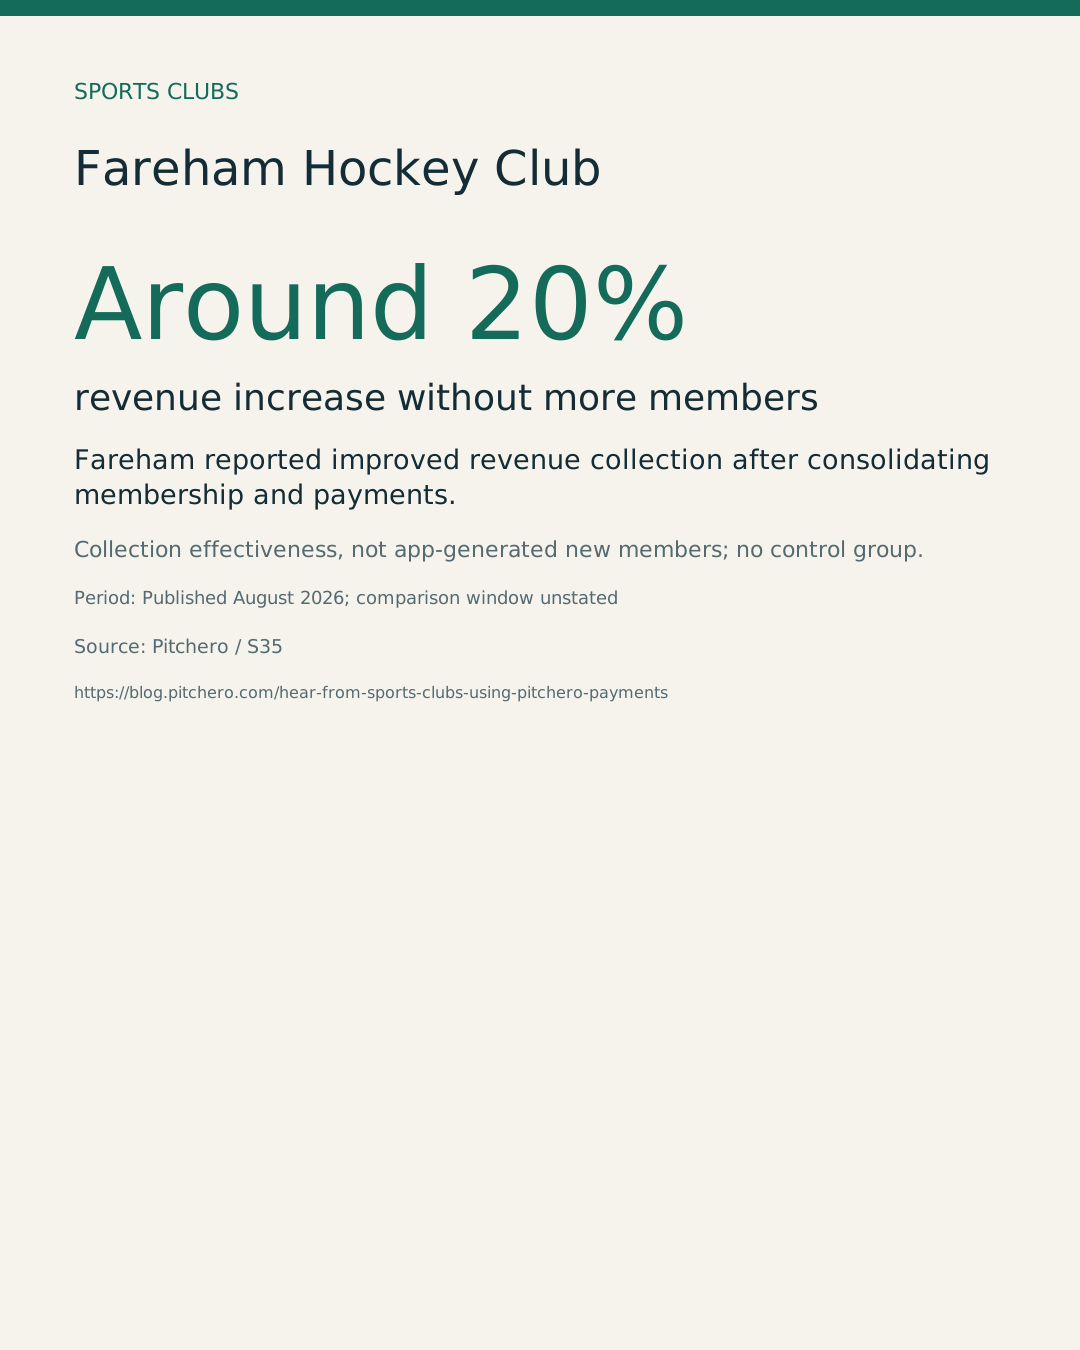
Around 20% revenue increase without more members
Source: Pitchero. Collection effectiveness, not app-generated new members; no control group.
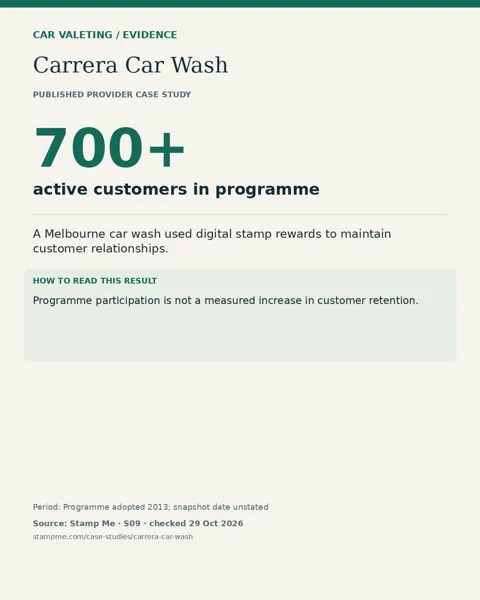
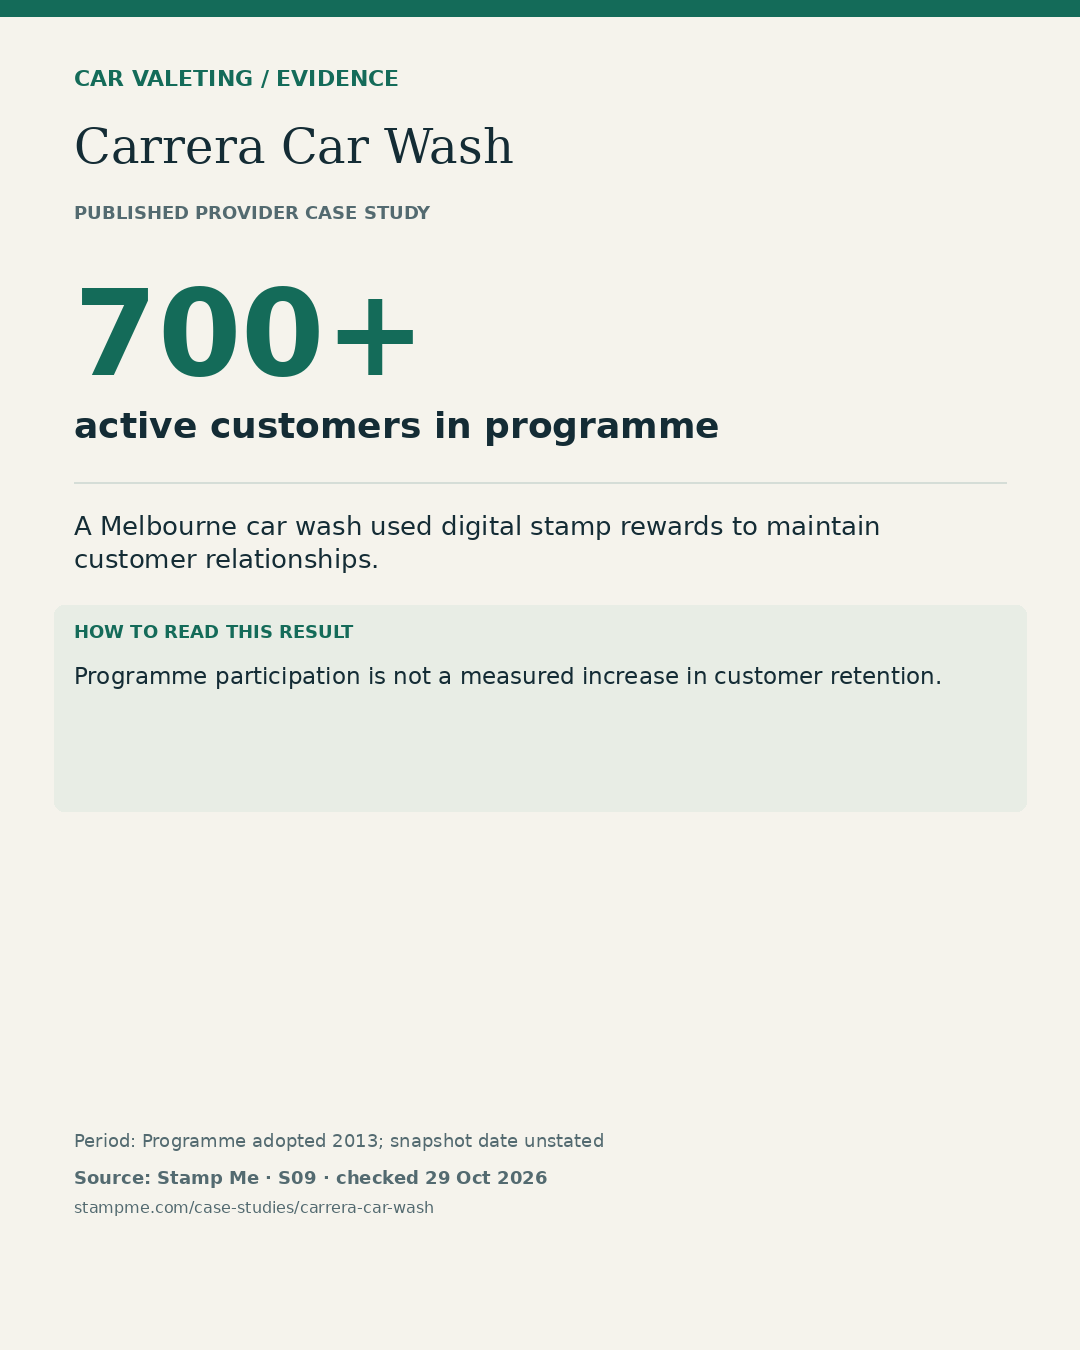
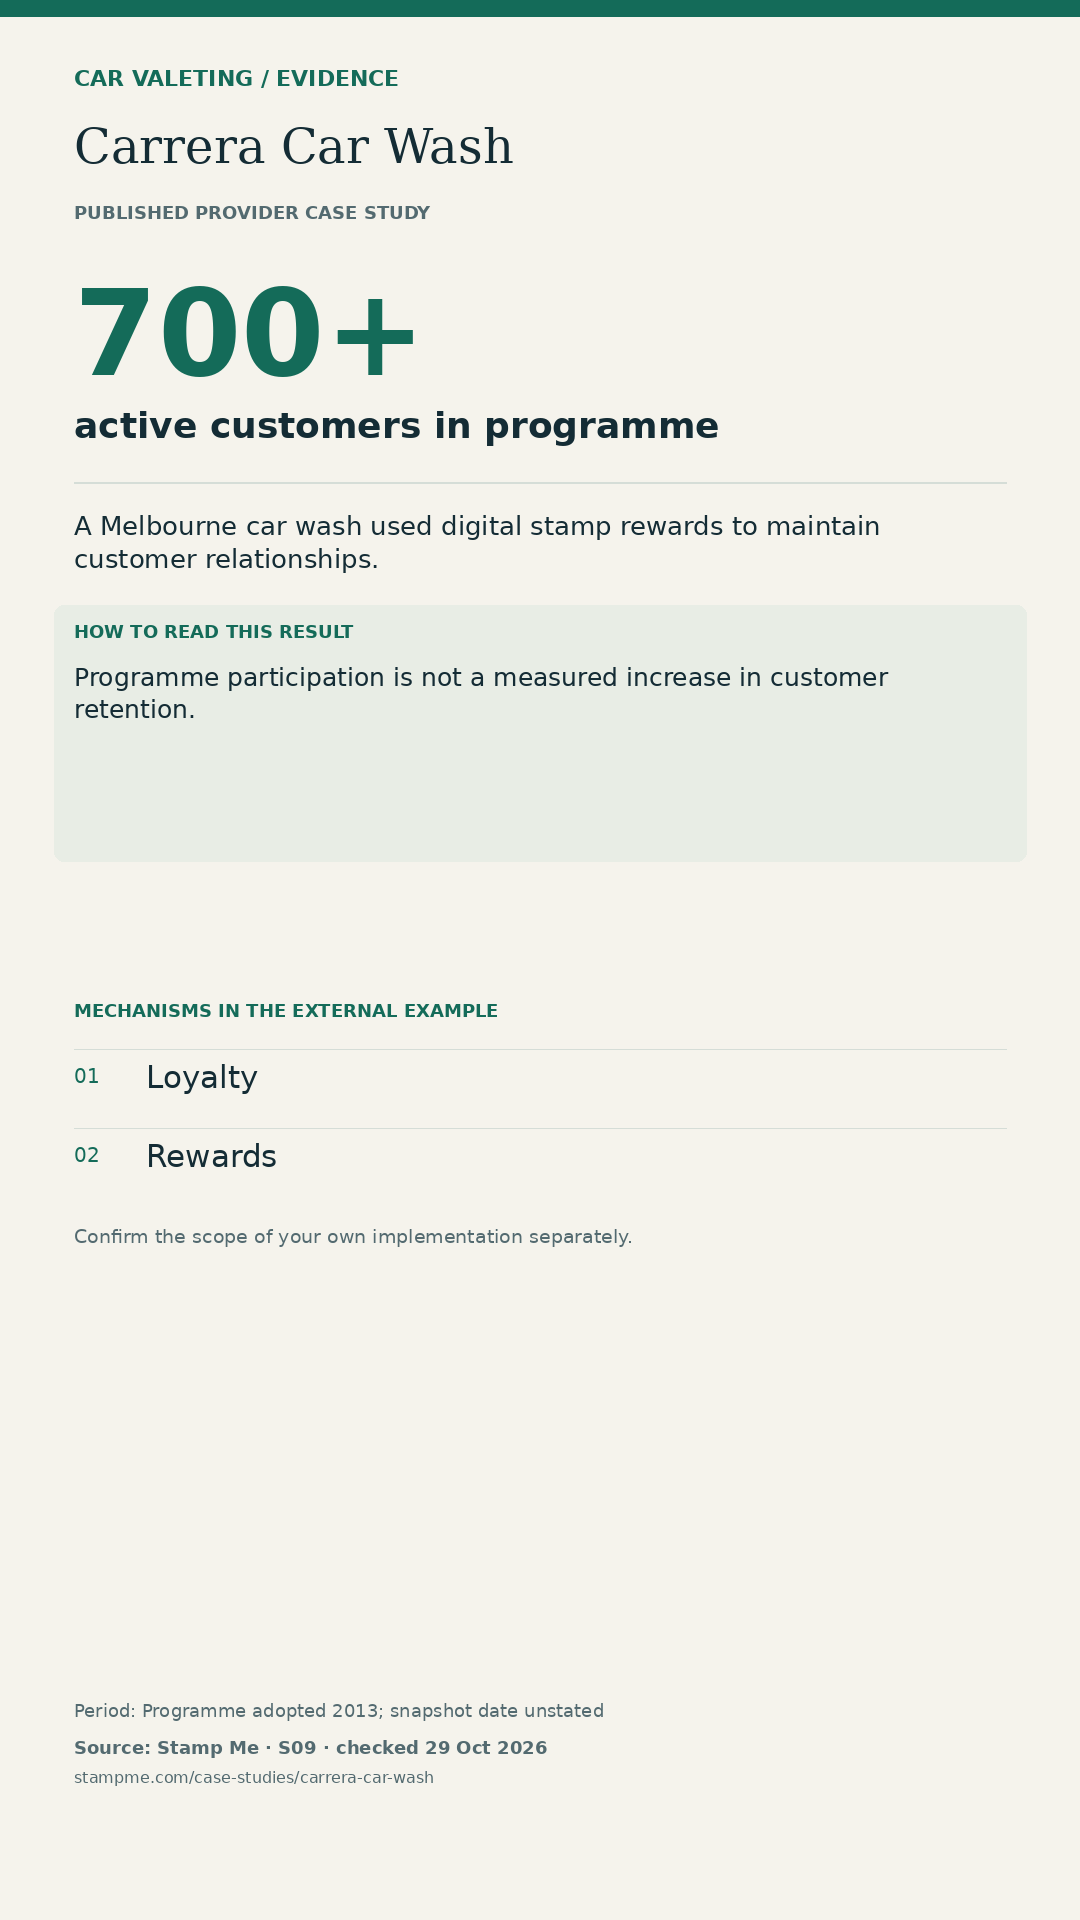
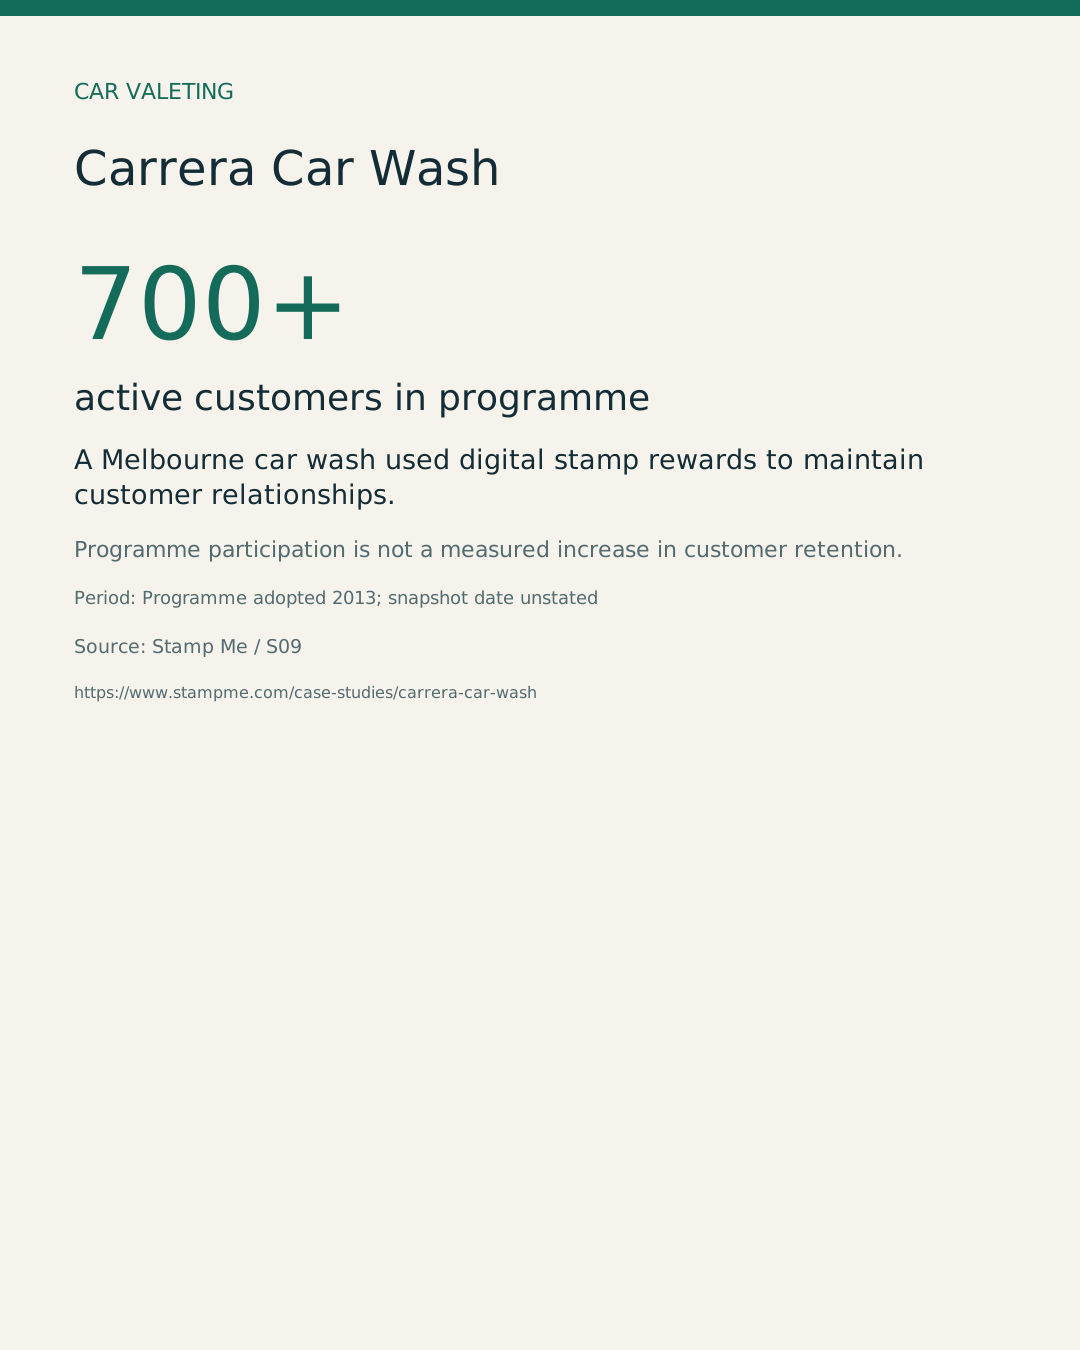
700+ active customers in programme
Source: Stamp Me. Programme participation is not a measured increase in customer retention.
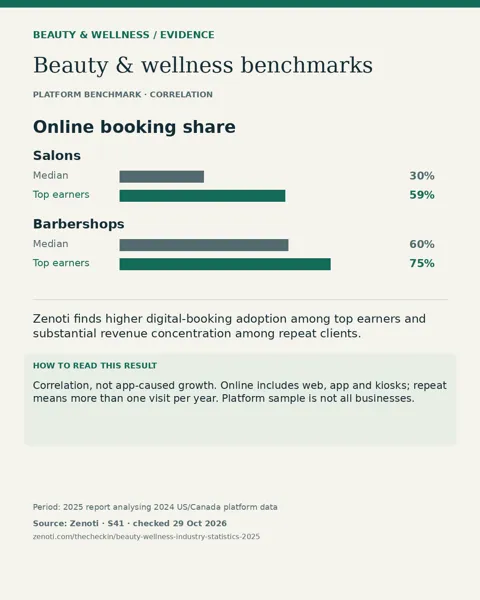
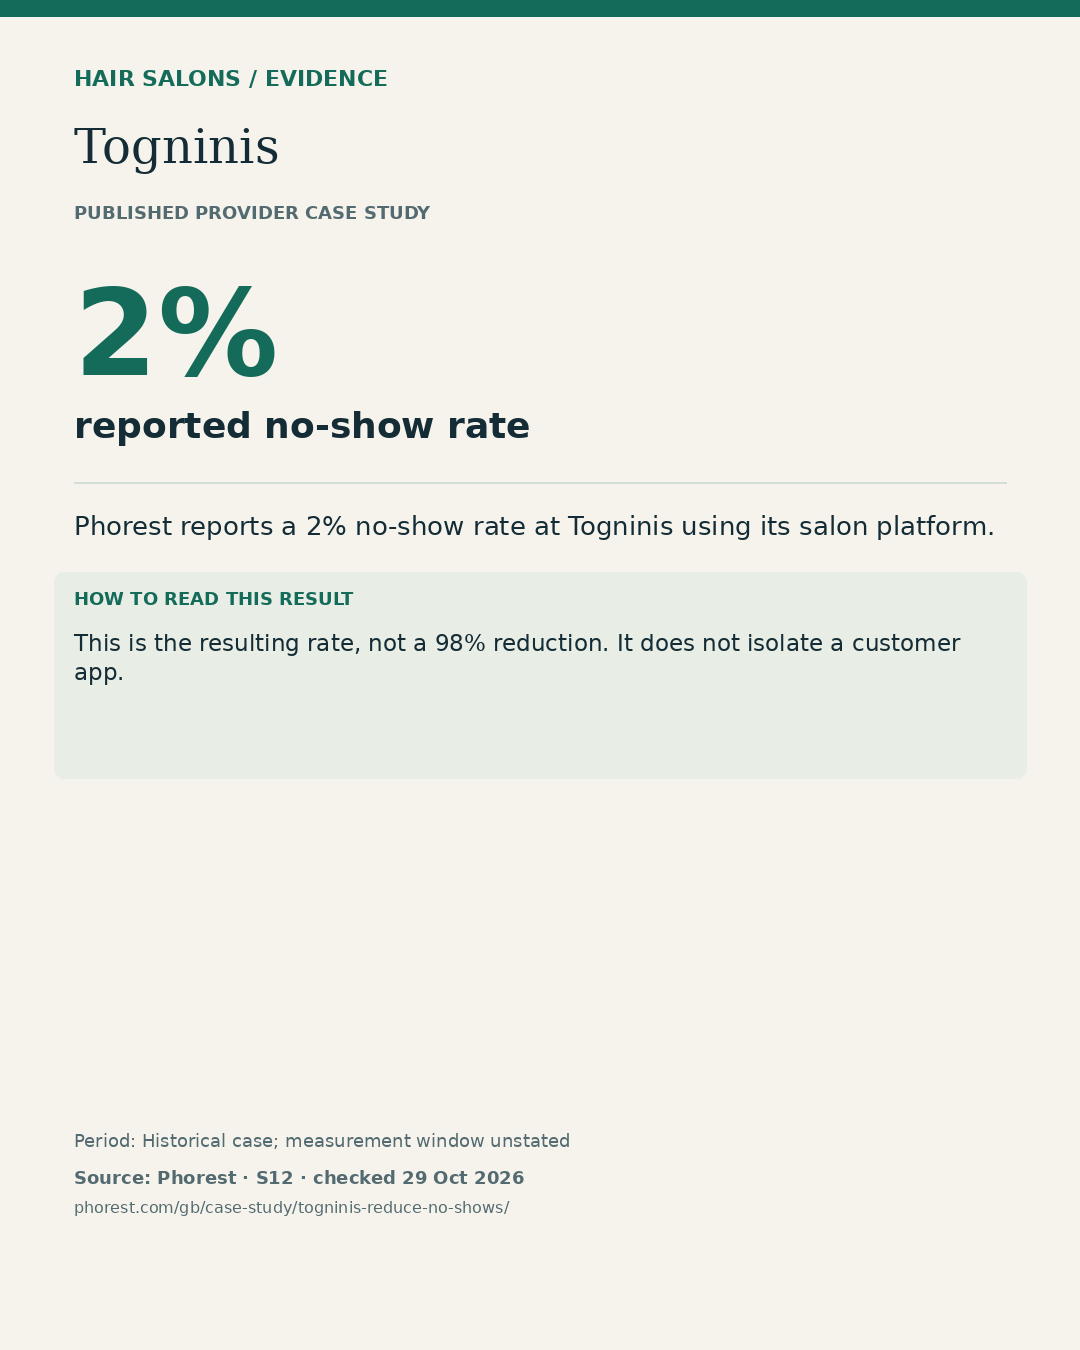
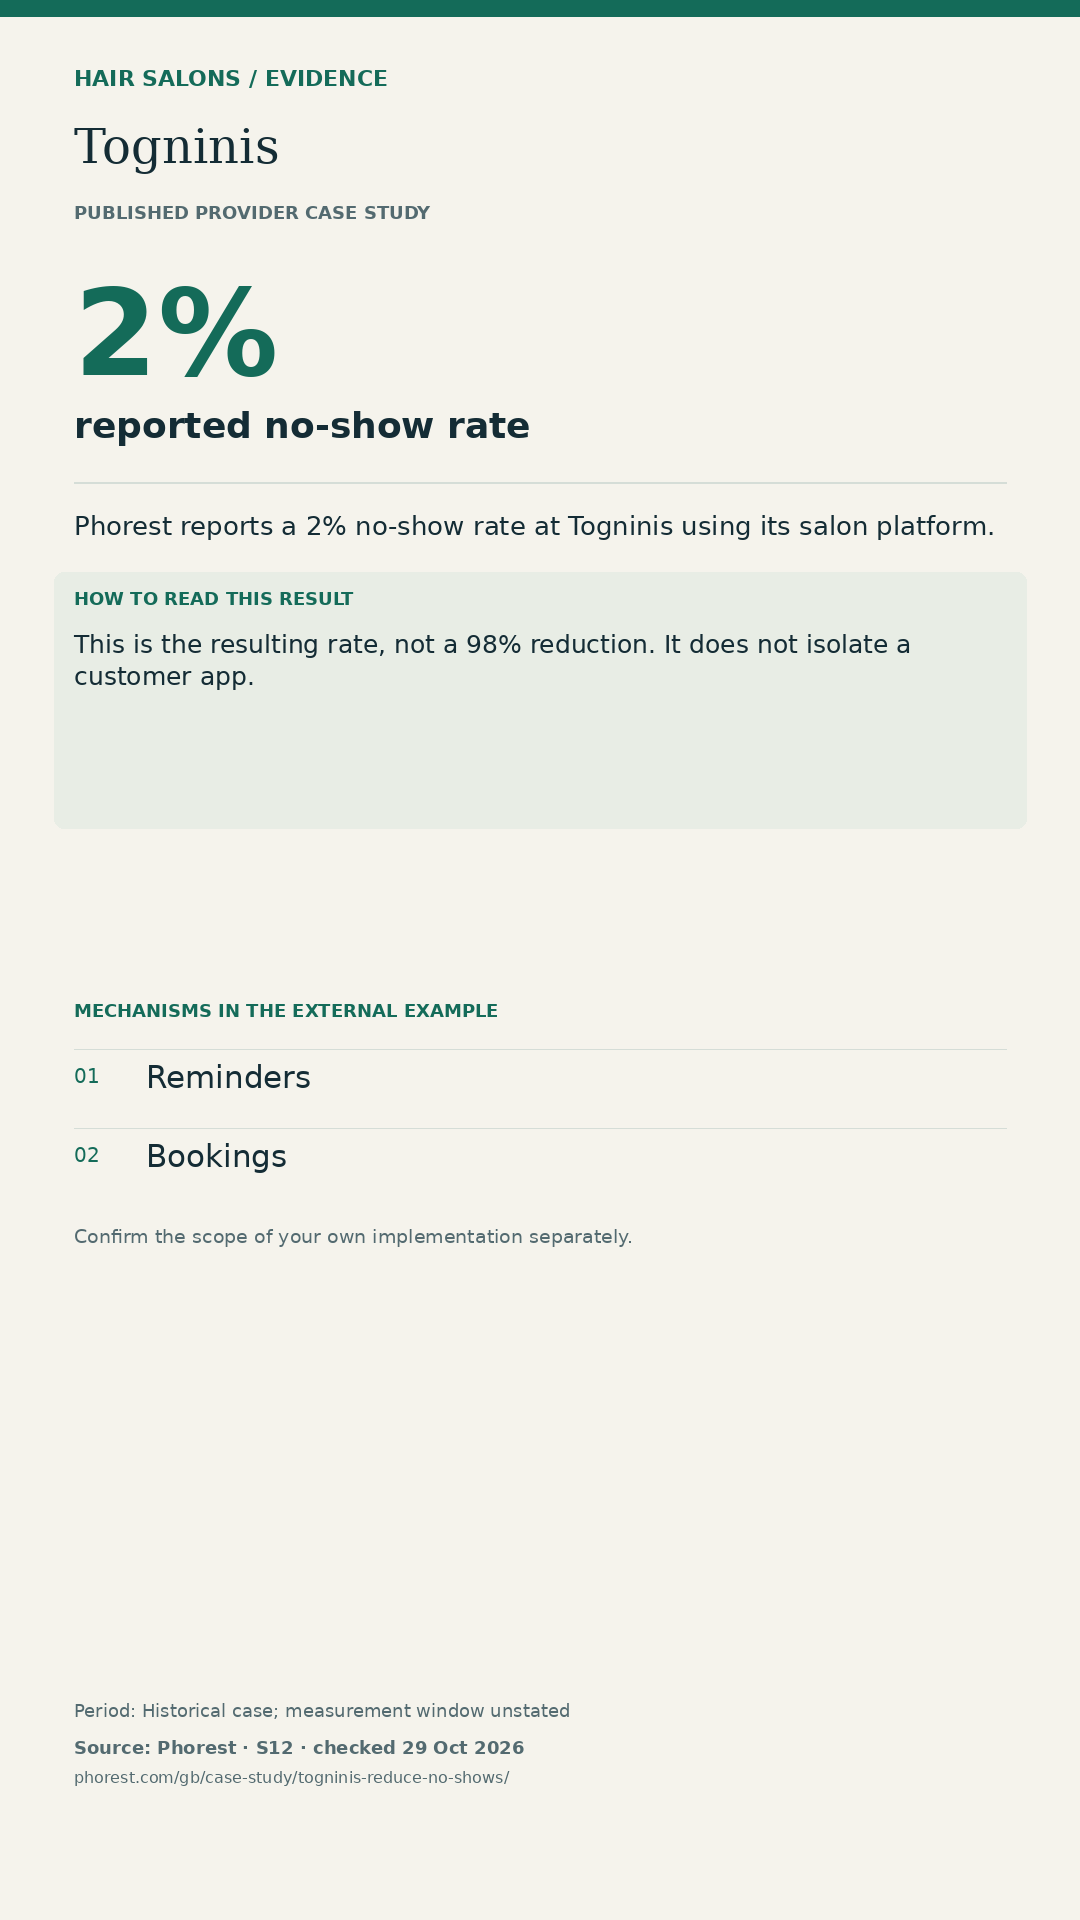
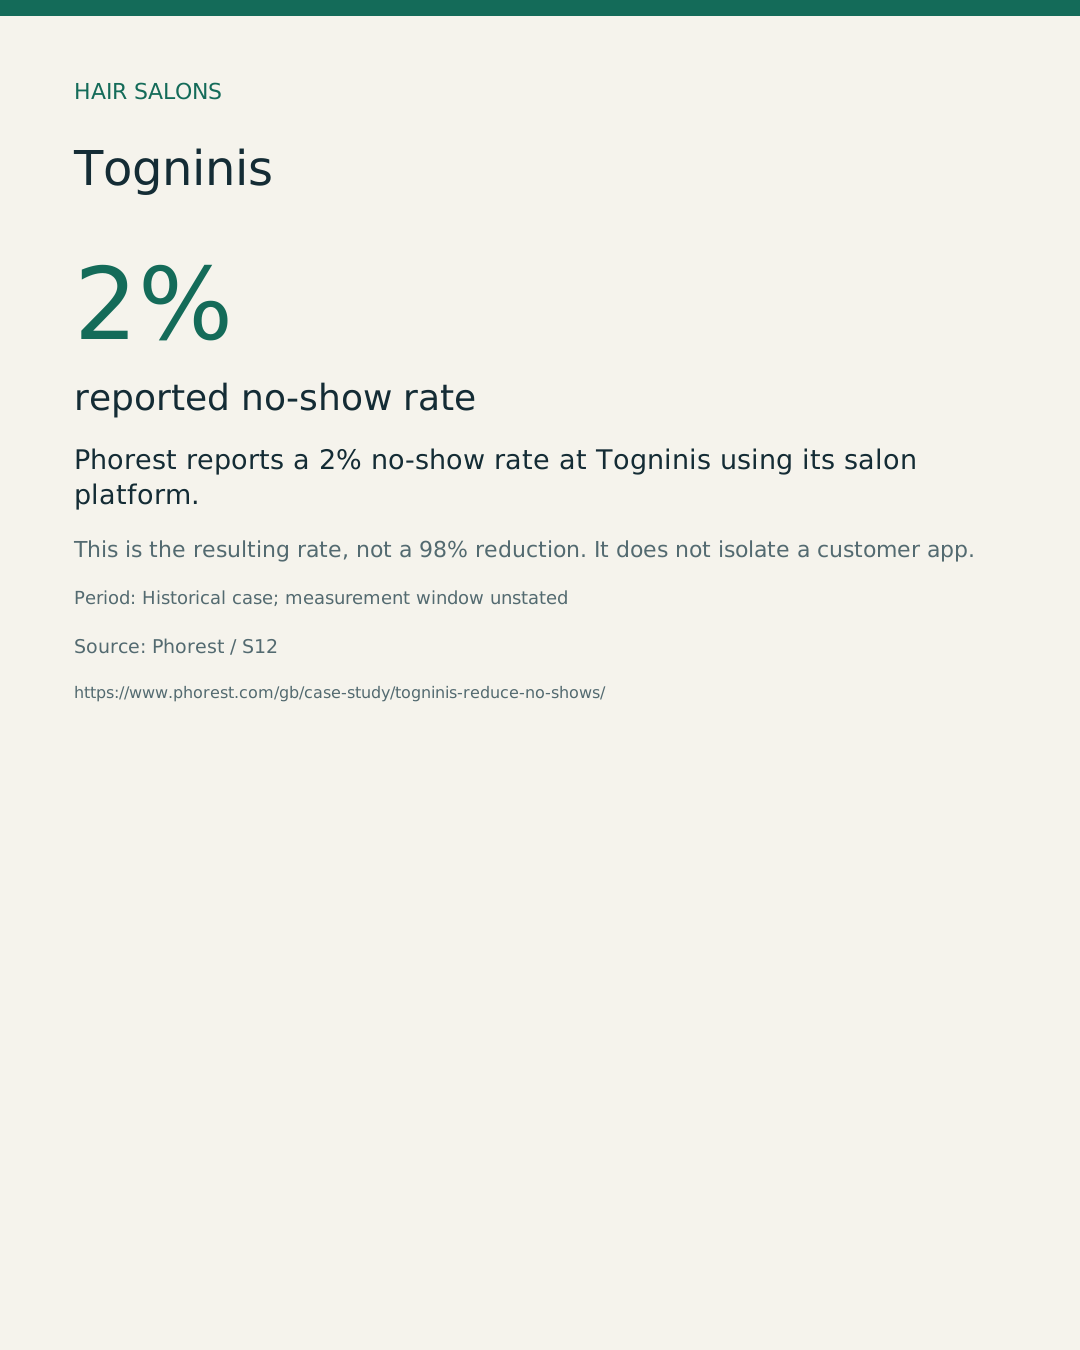
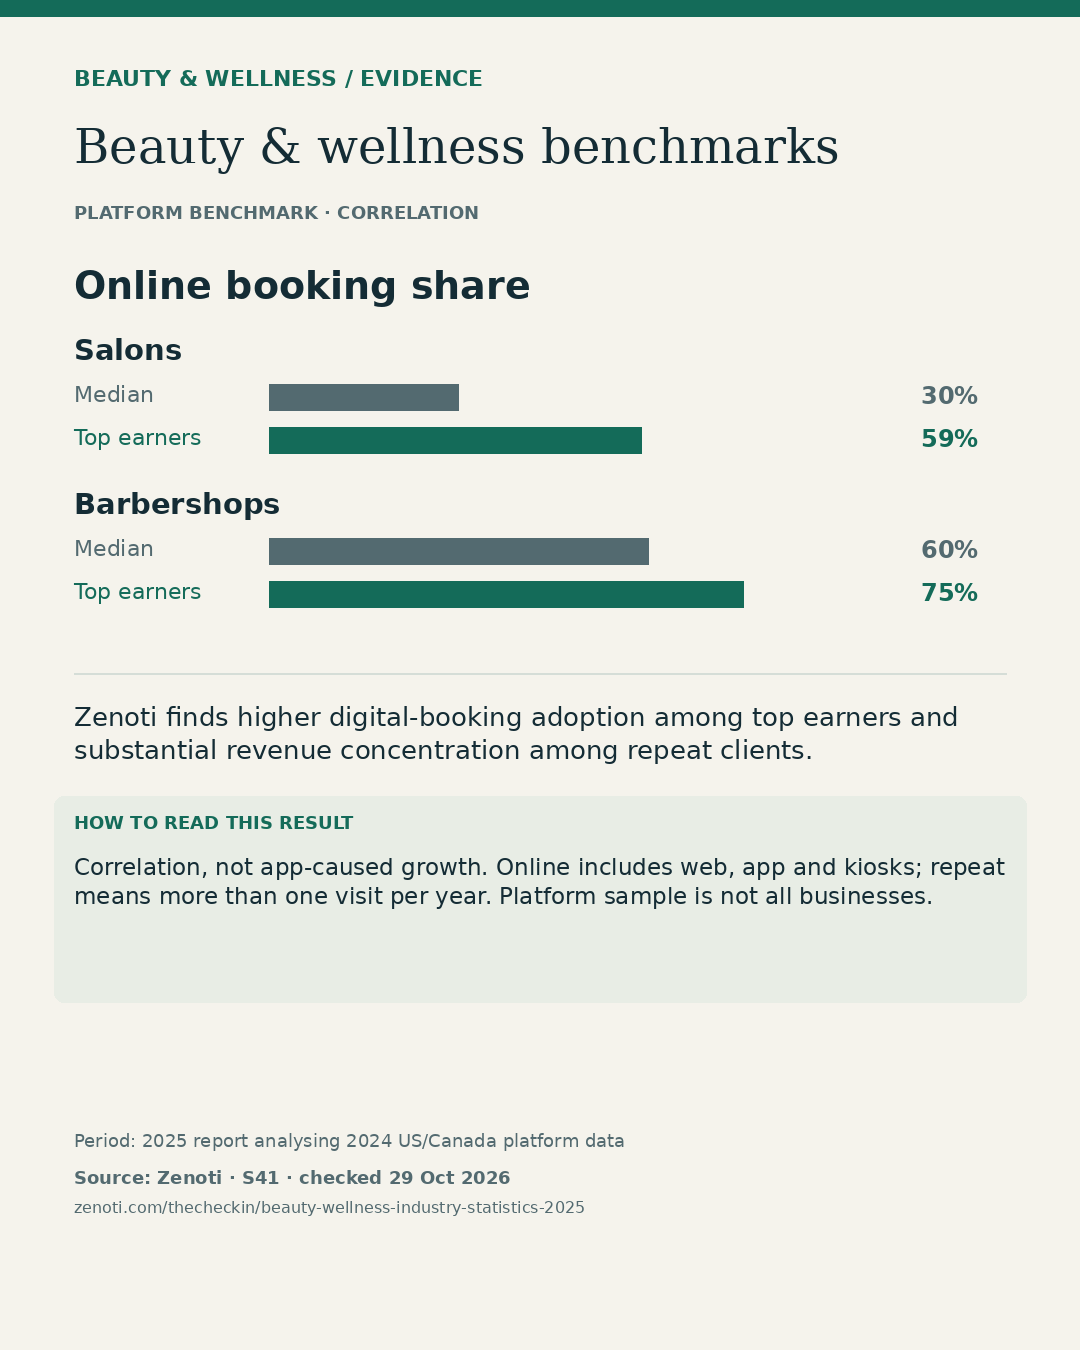
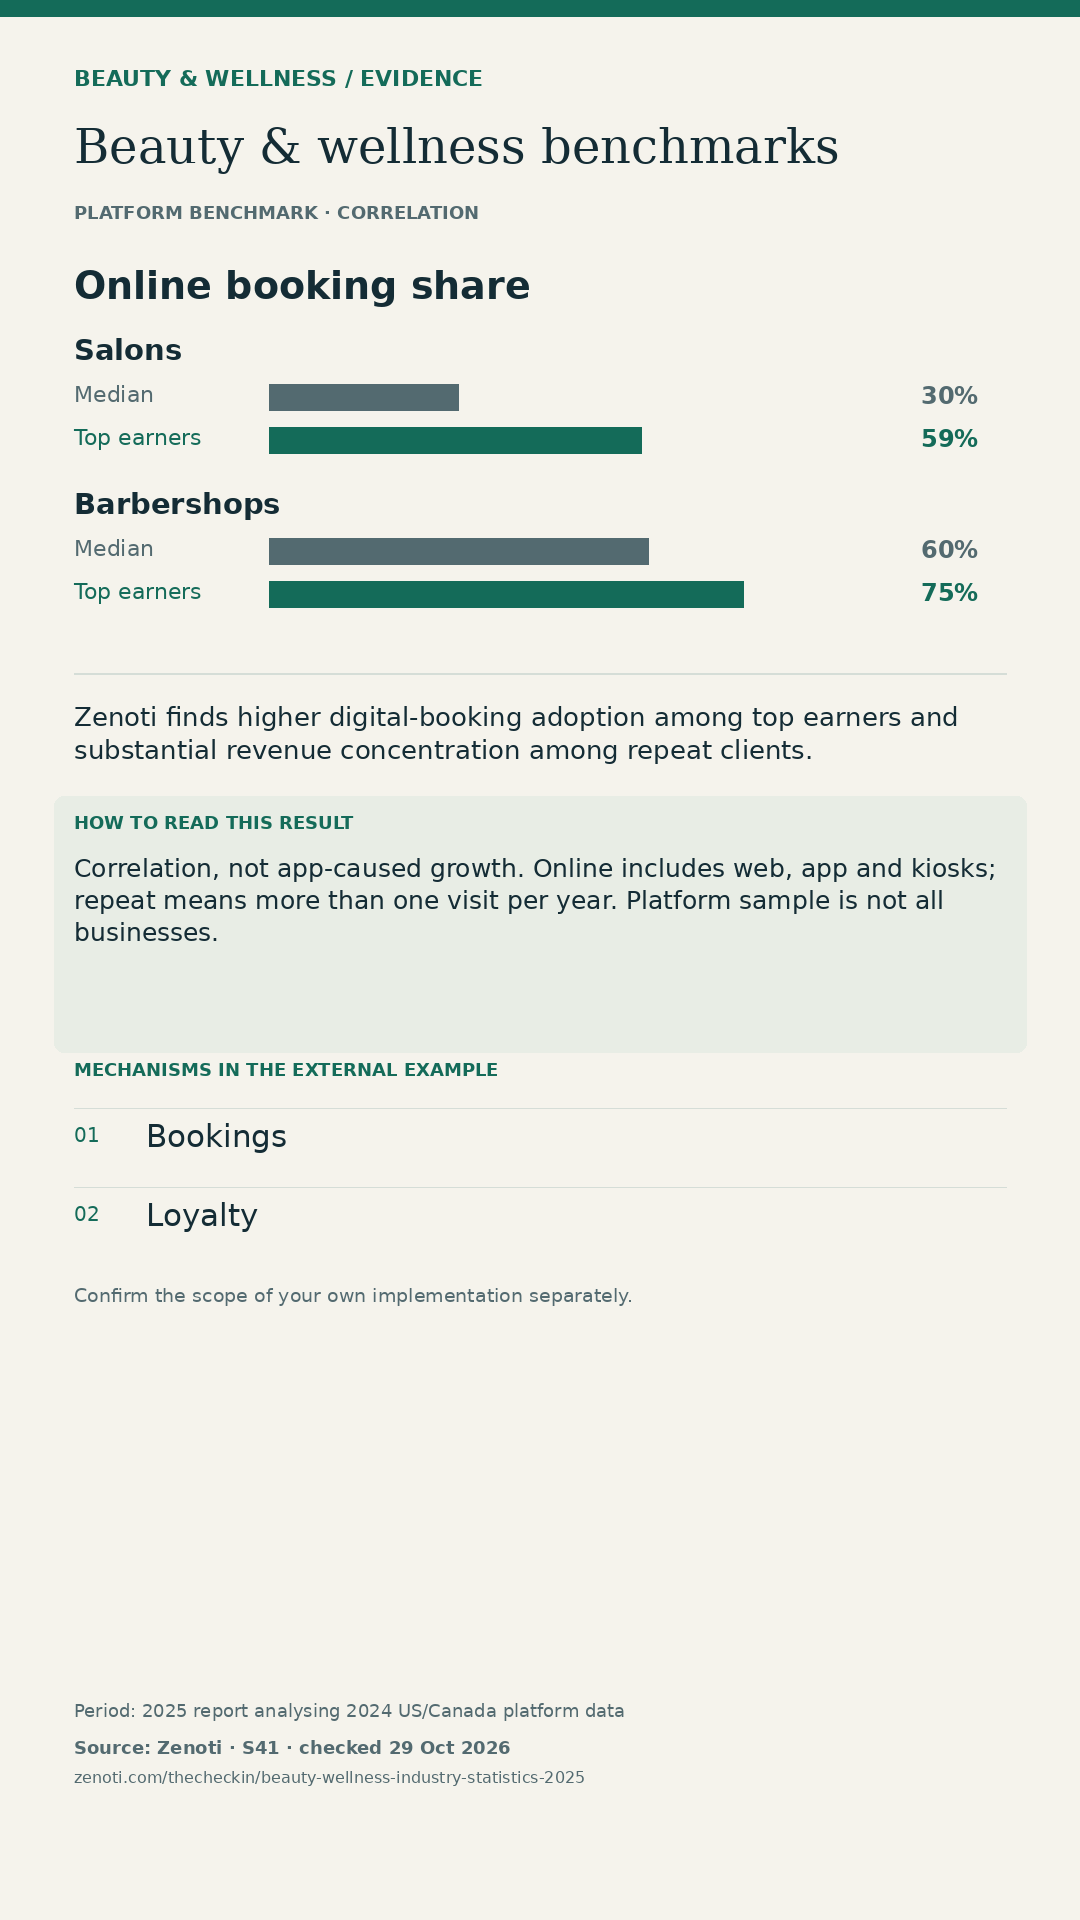
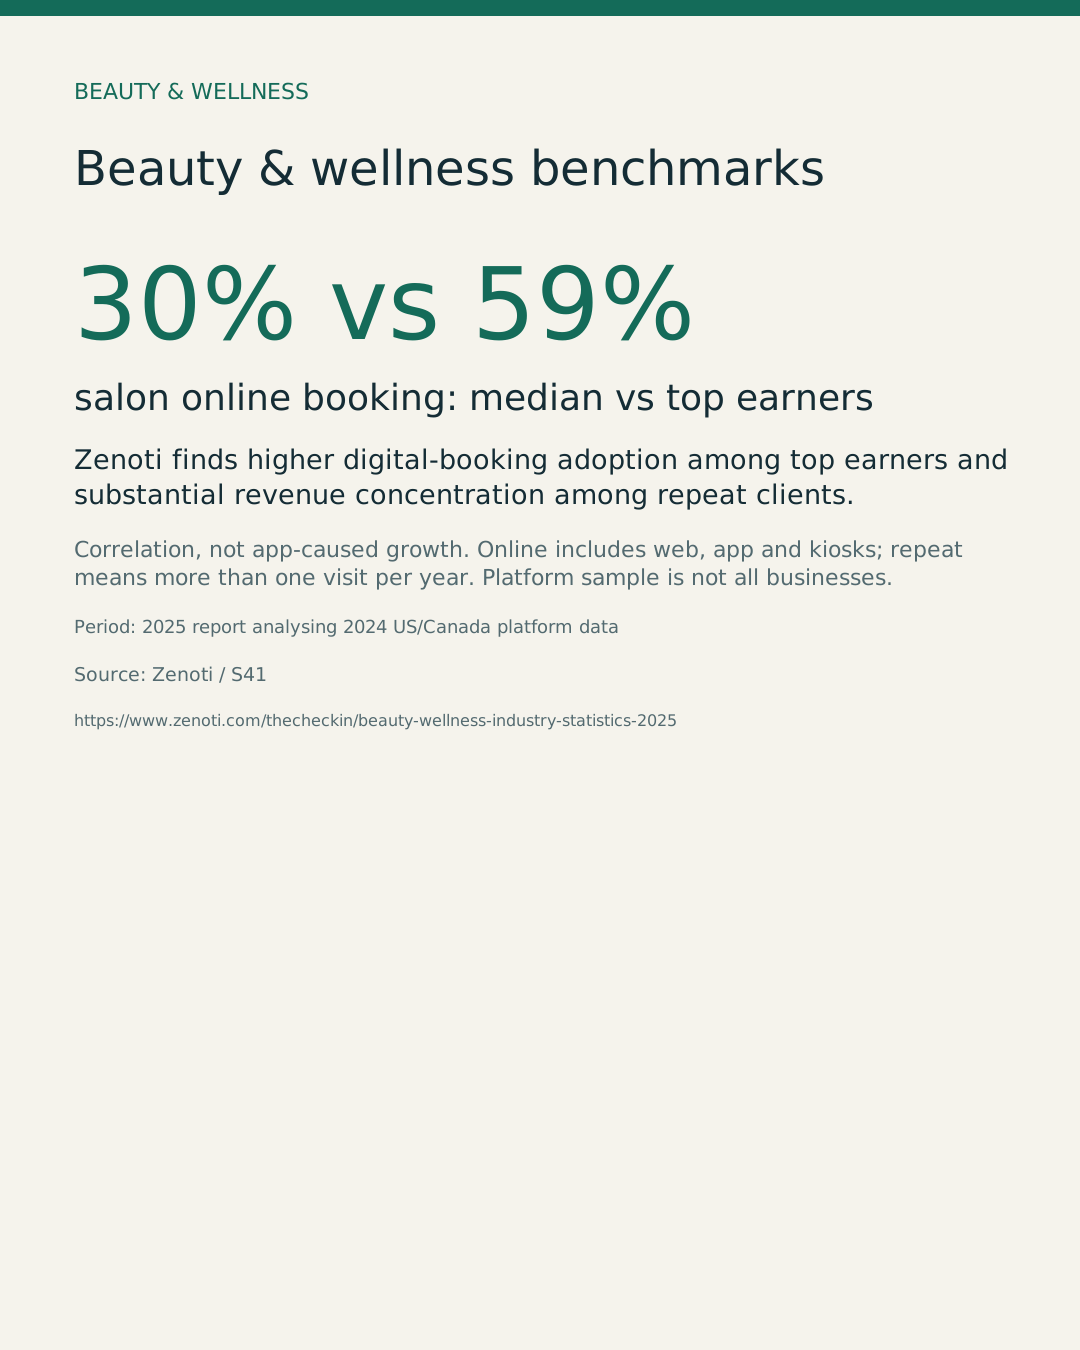
30% vs 59% salon online booking: median vs top earners
Source: Zenoti. Correlation, not app-caused growth. Online includes web, app and kiosks; repeat means more than one visit per year. Platform sample is not all businesses.
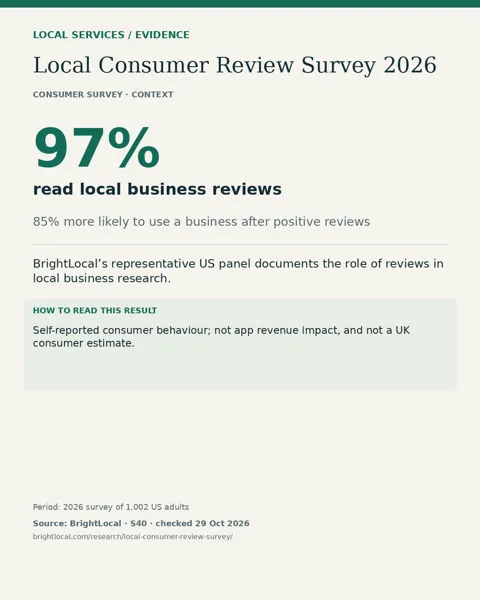
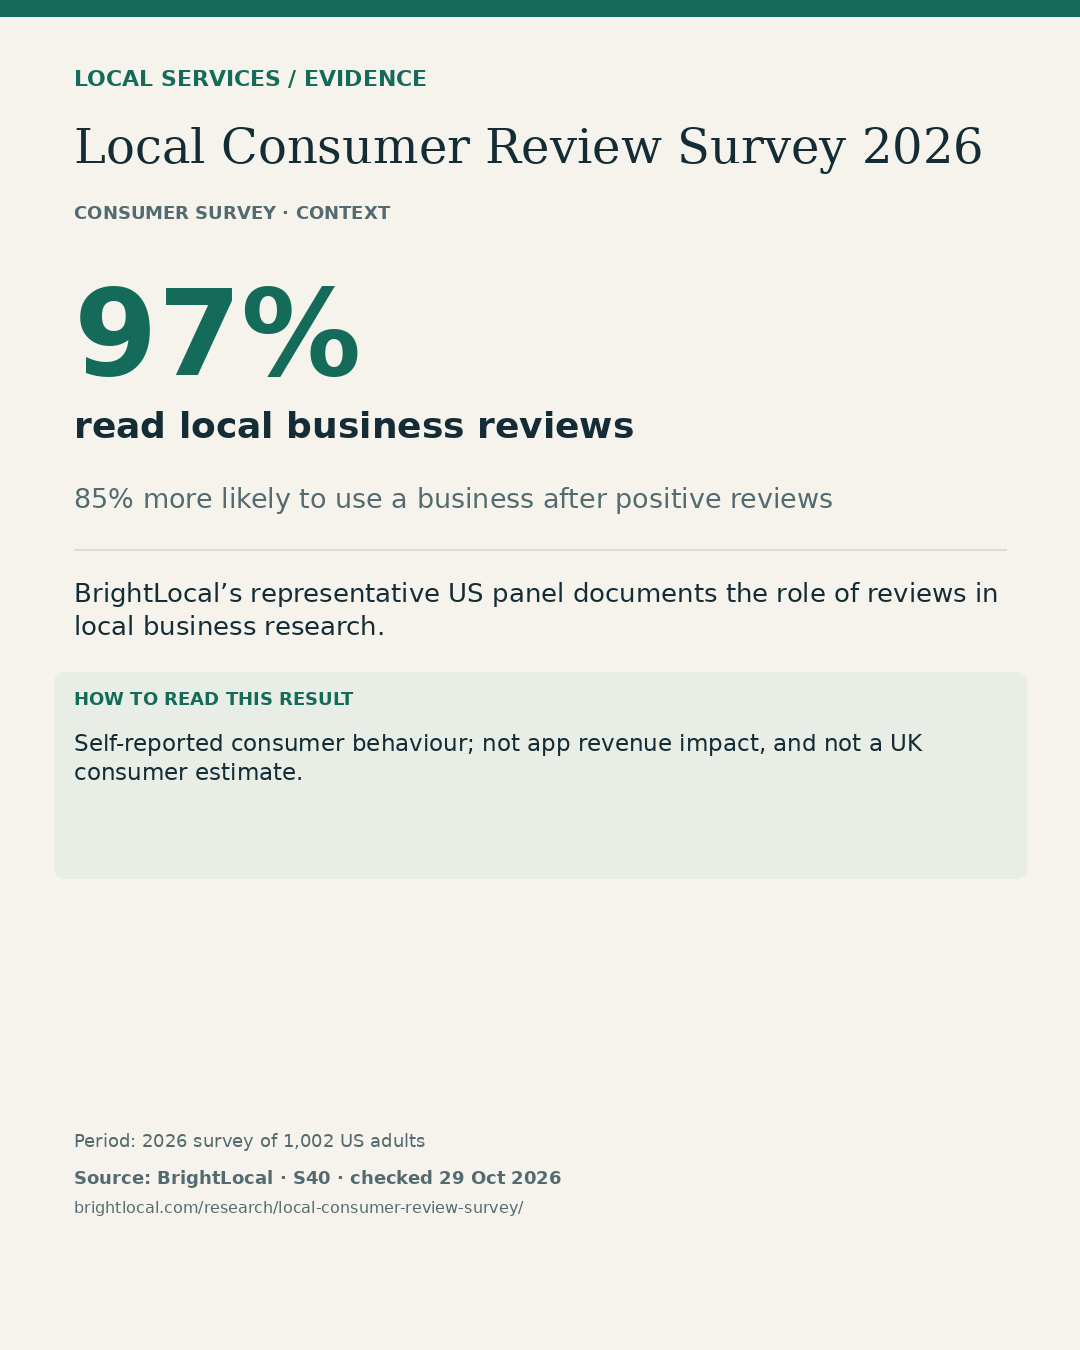
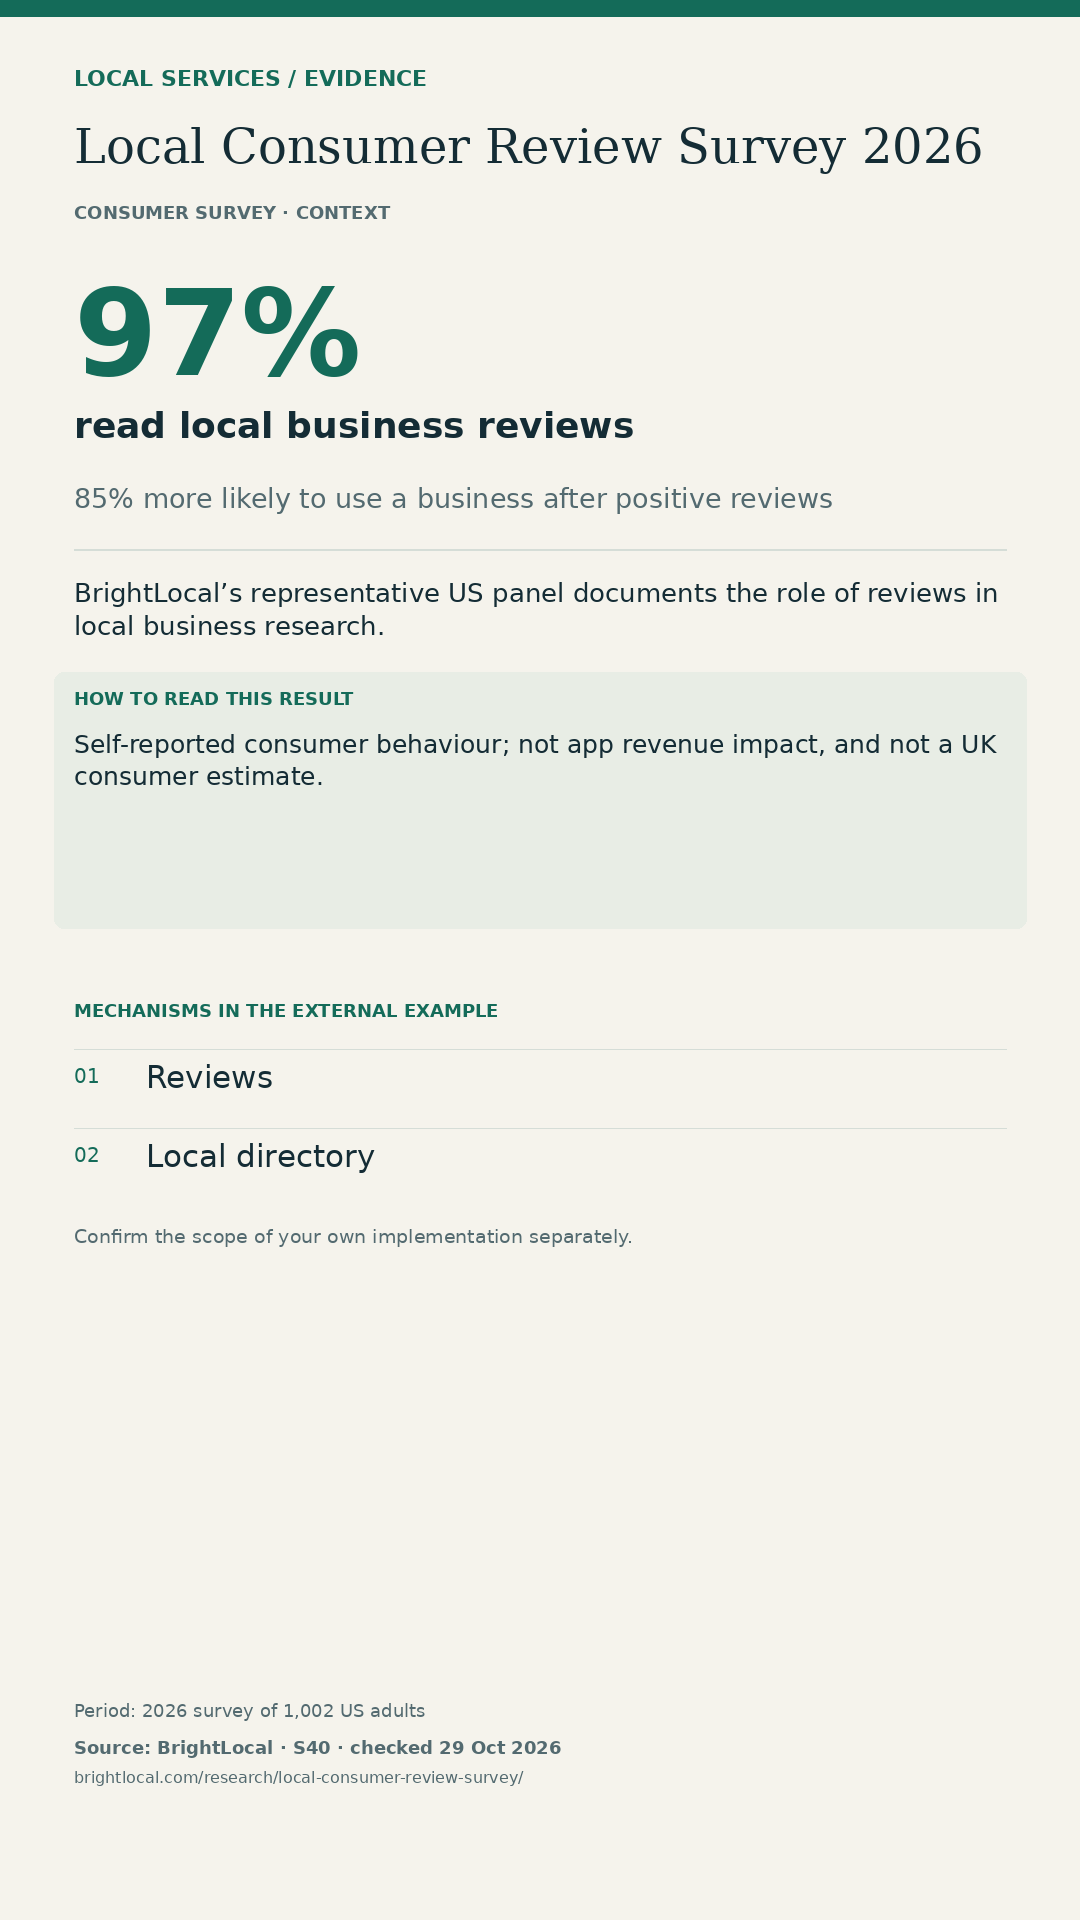
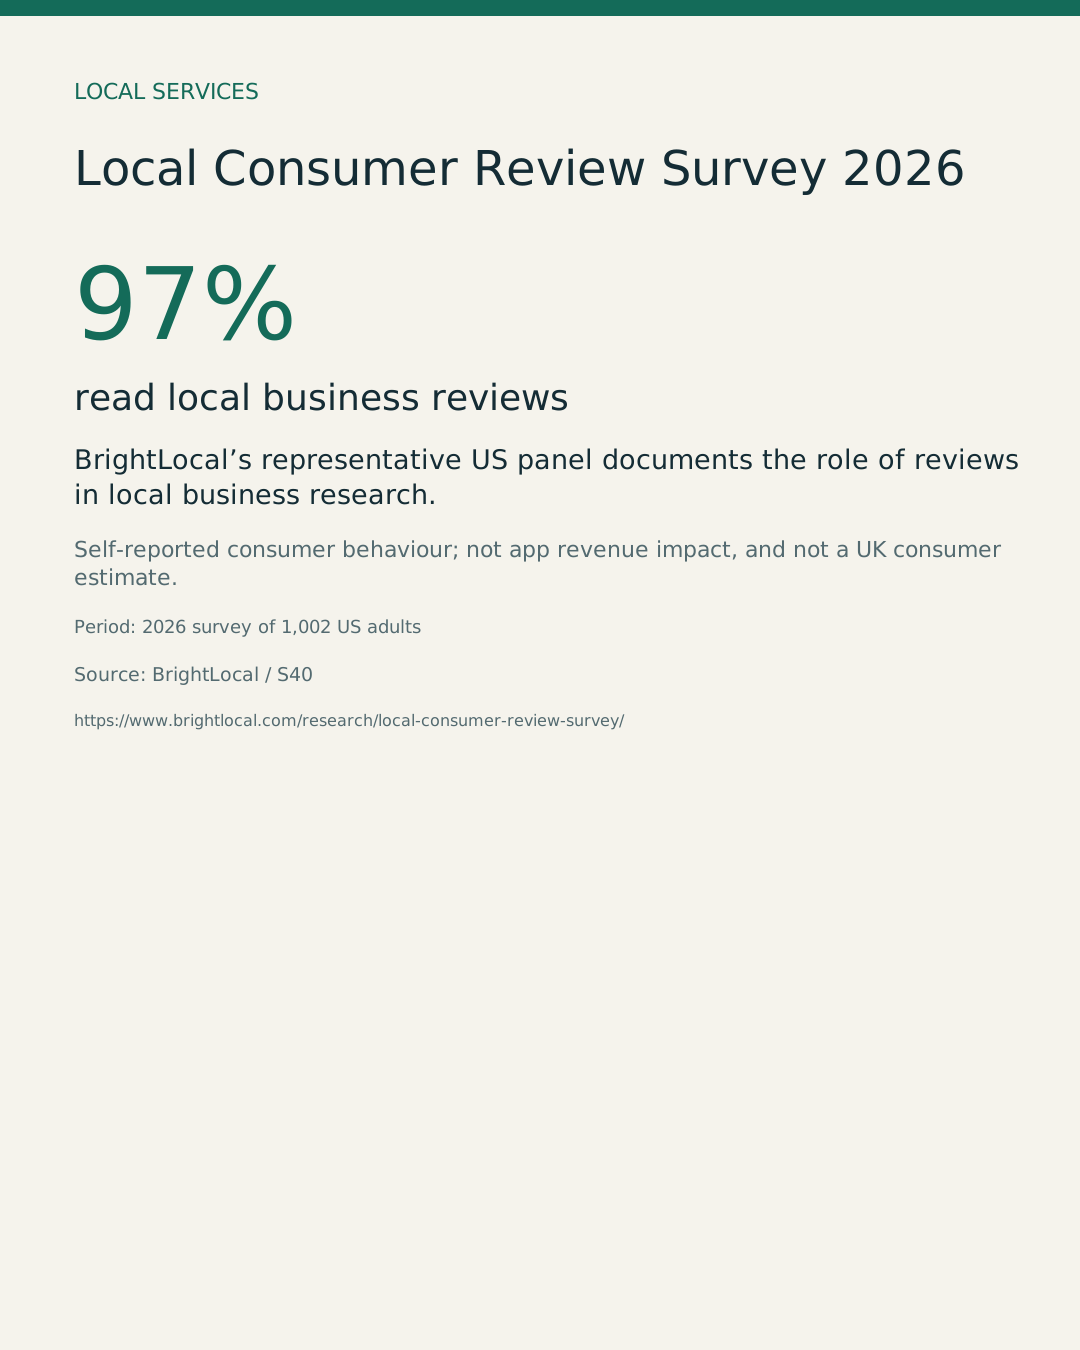
97% read local business reviews
Source: BrightLocal. Self-reported consumer behaviour; not app revenue impact, and not a UK consumer estimate.
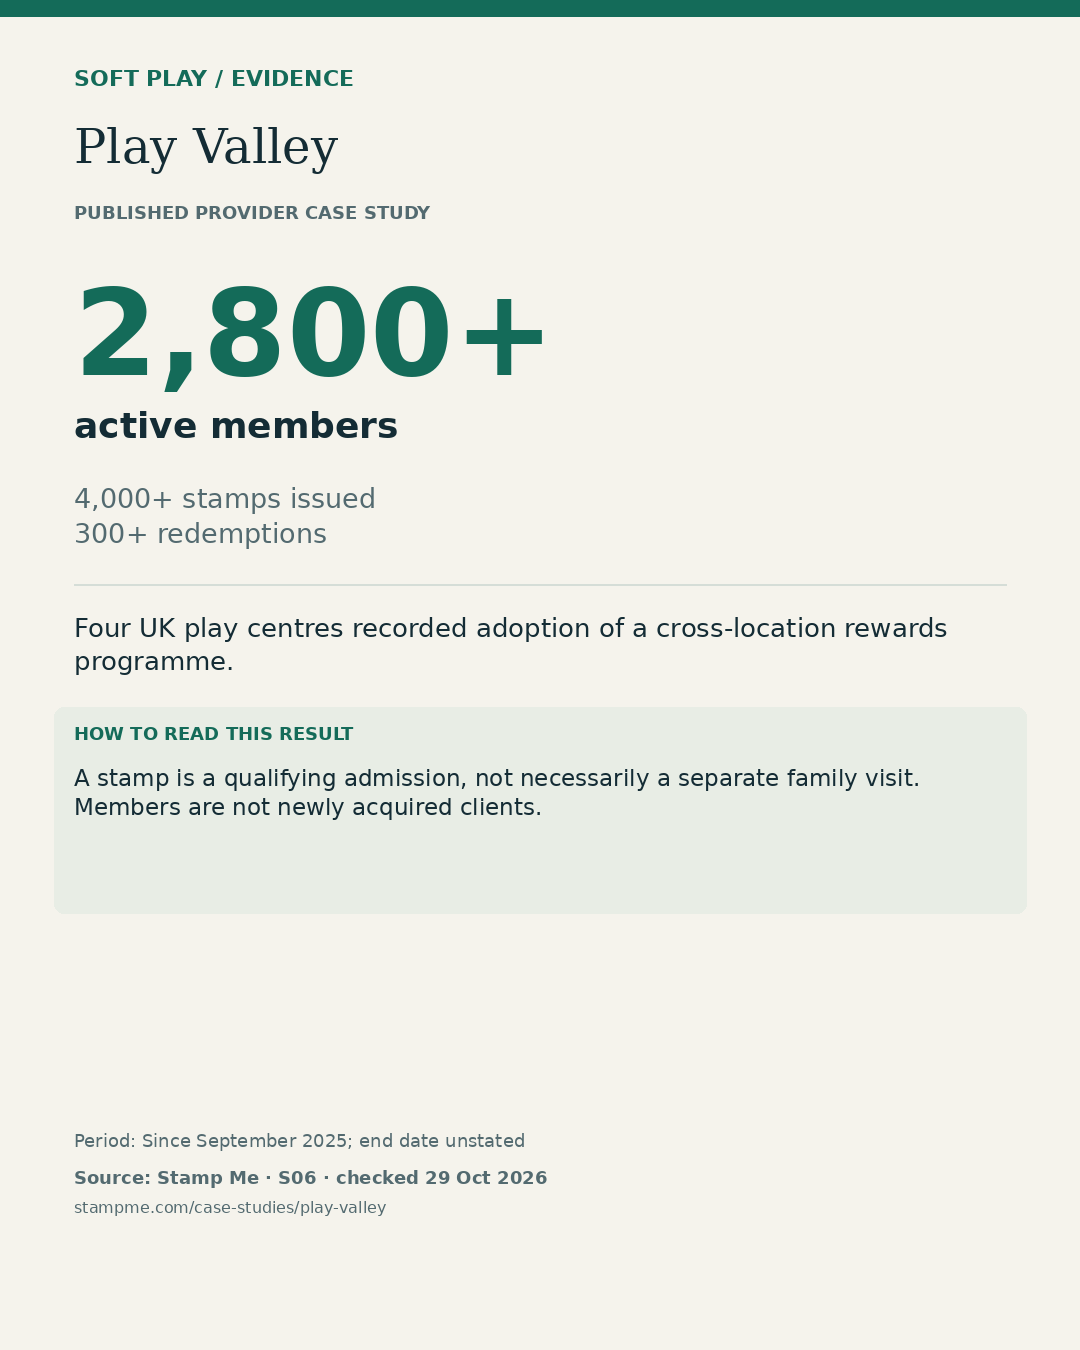
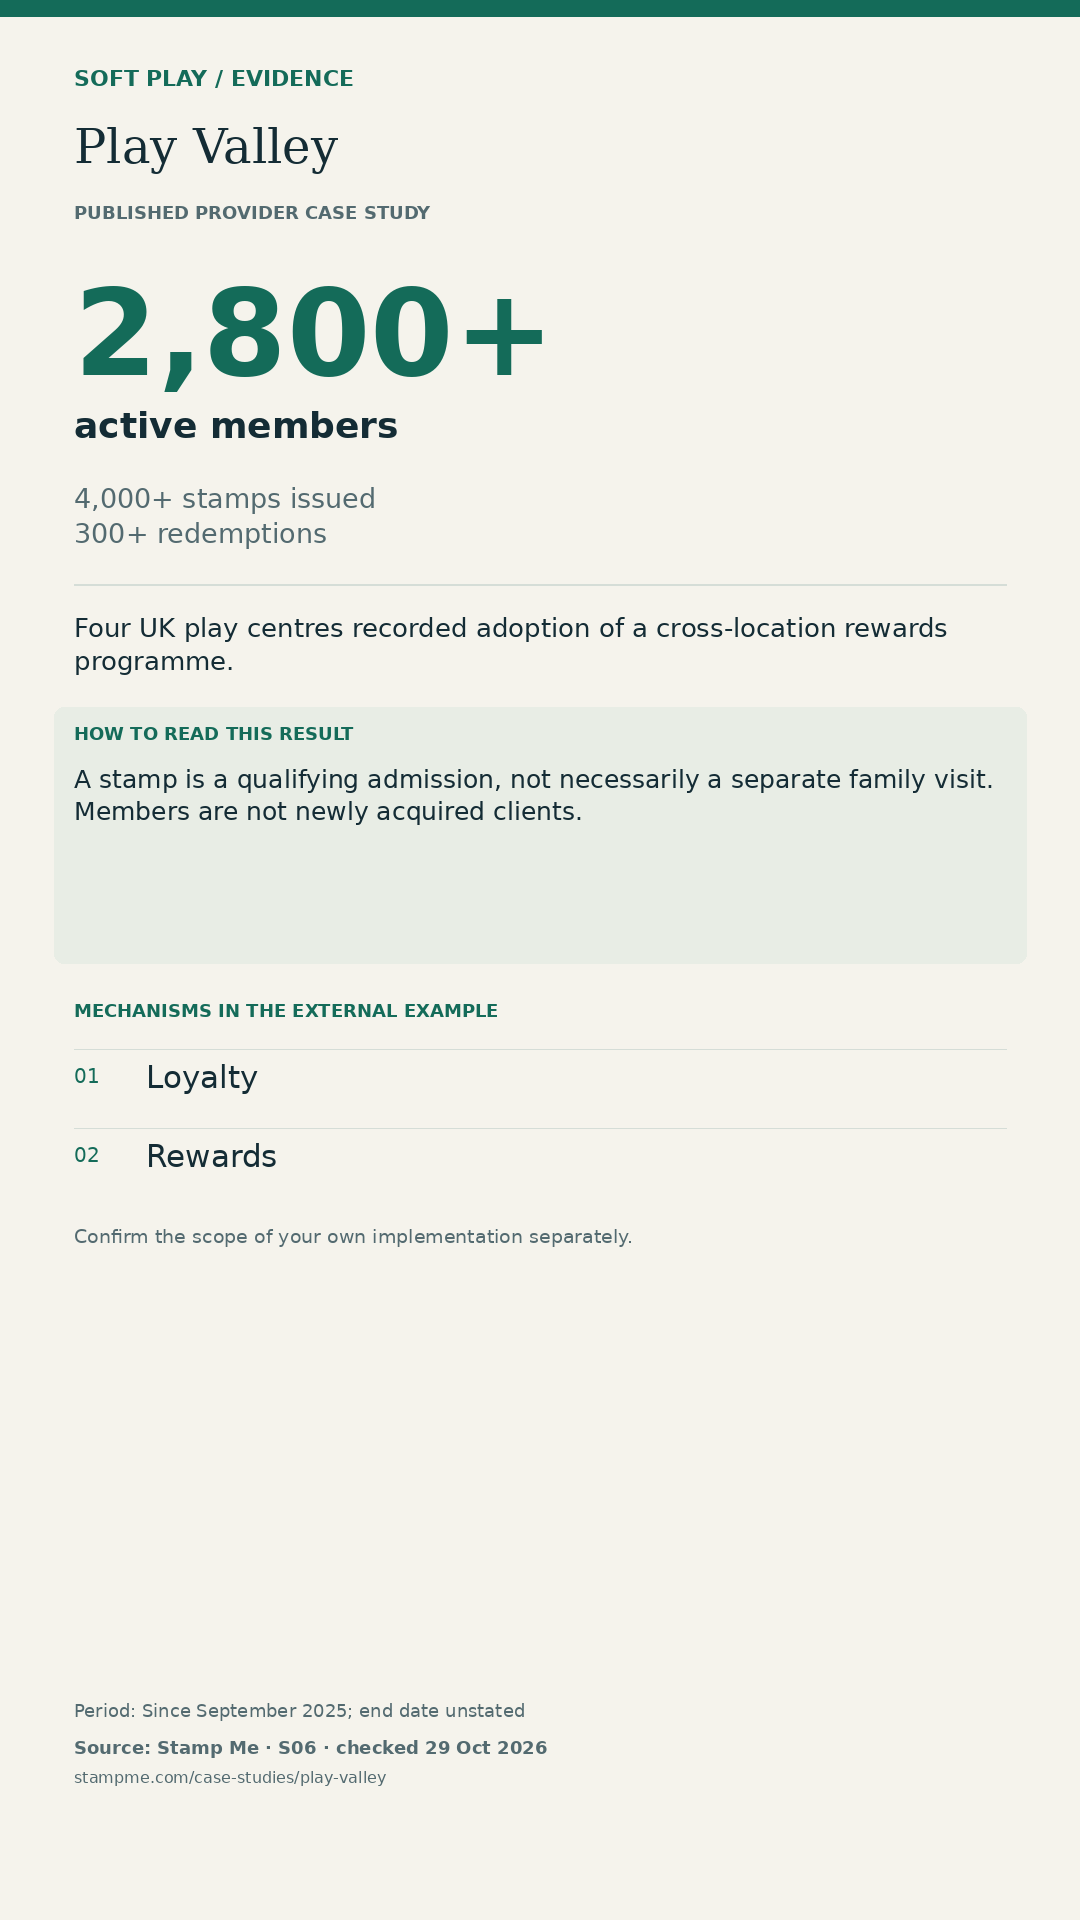
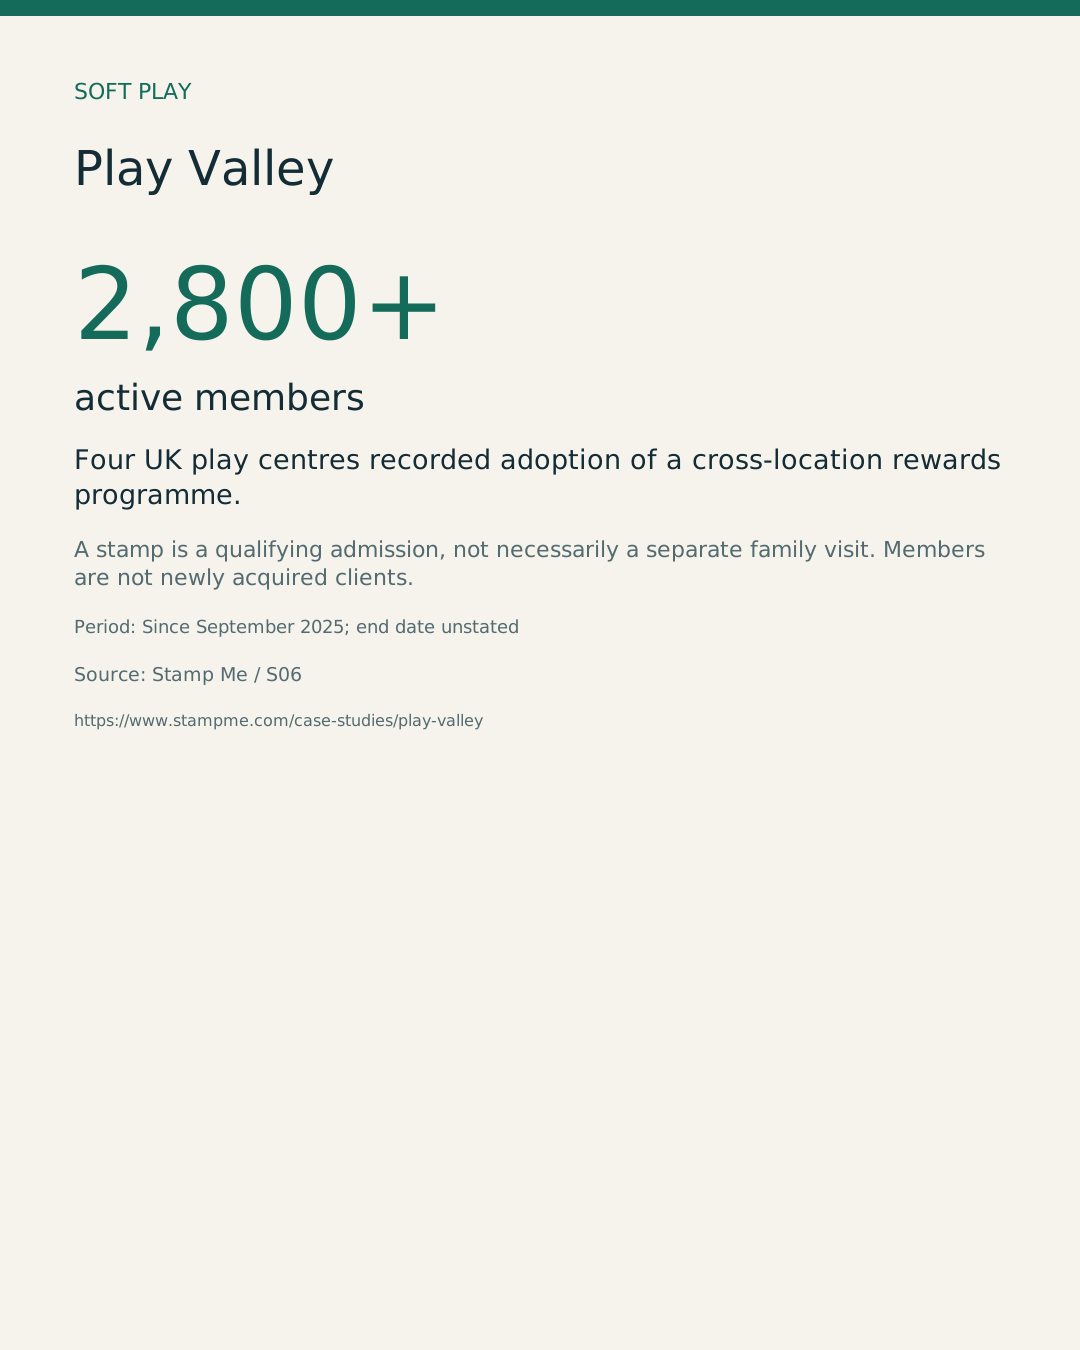
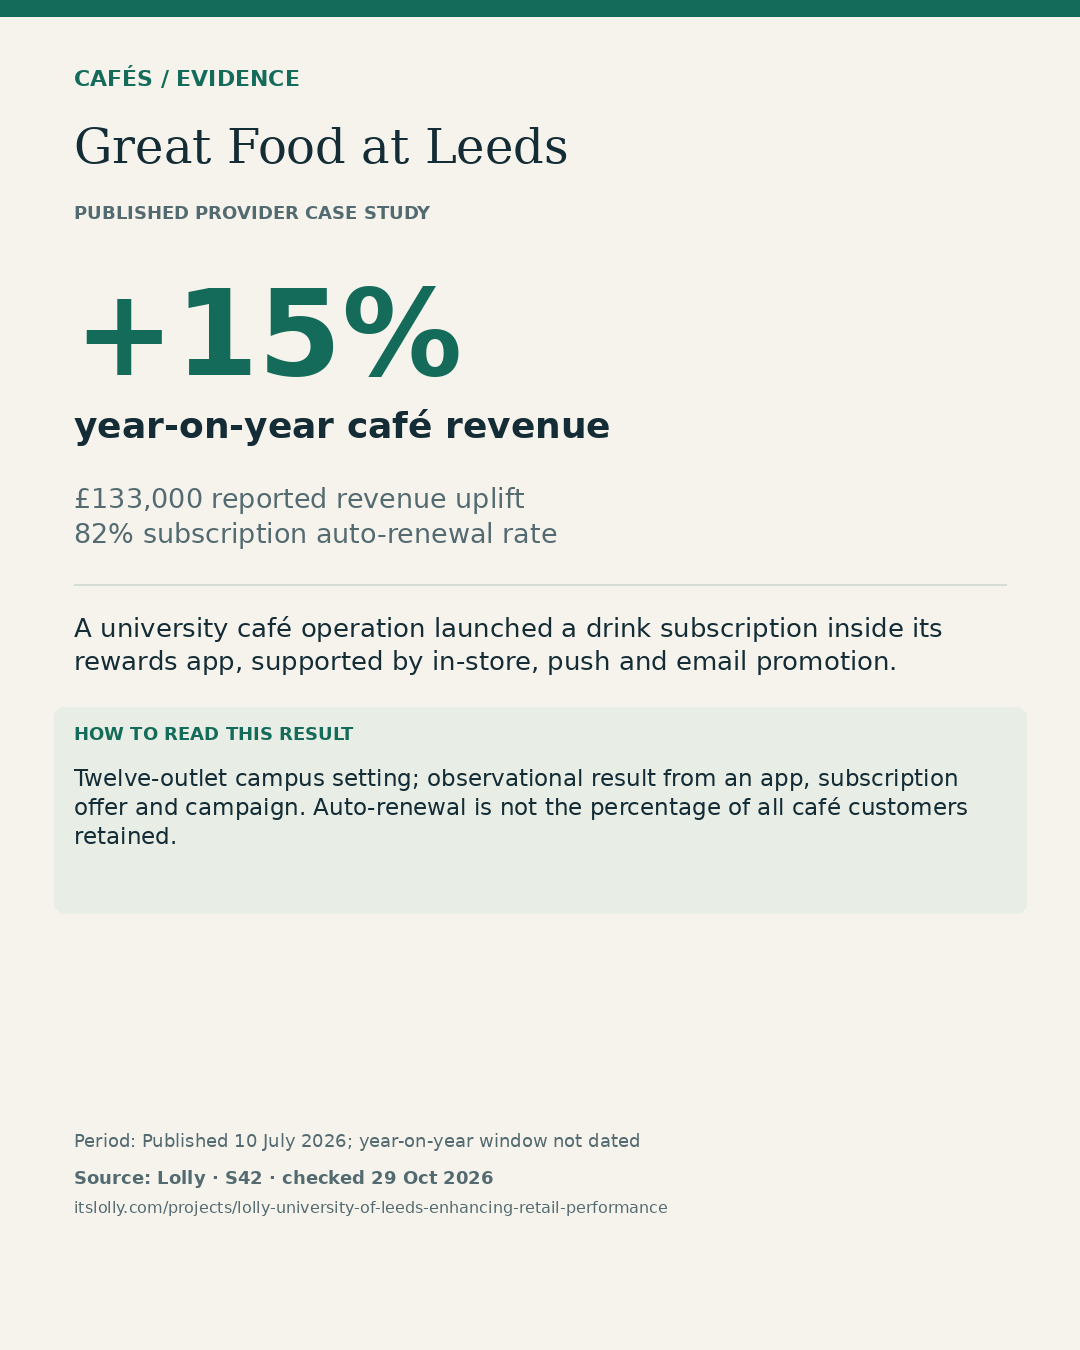
2,800+ active members
Source: Stamp Me. A stamp is a qualifying admission, not necessarily a separate family visit. Members are not newly acquired clients.